Land use change in the Gola-Foya priority landscape
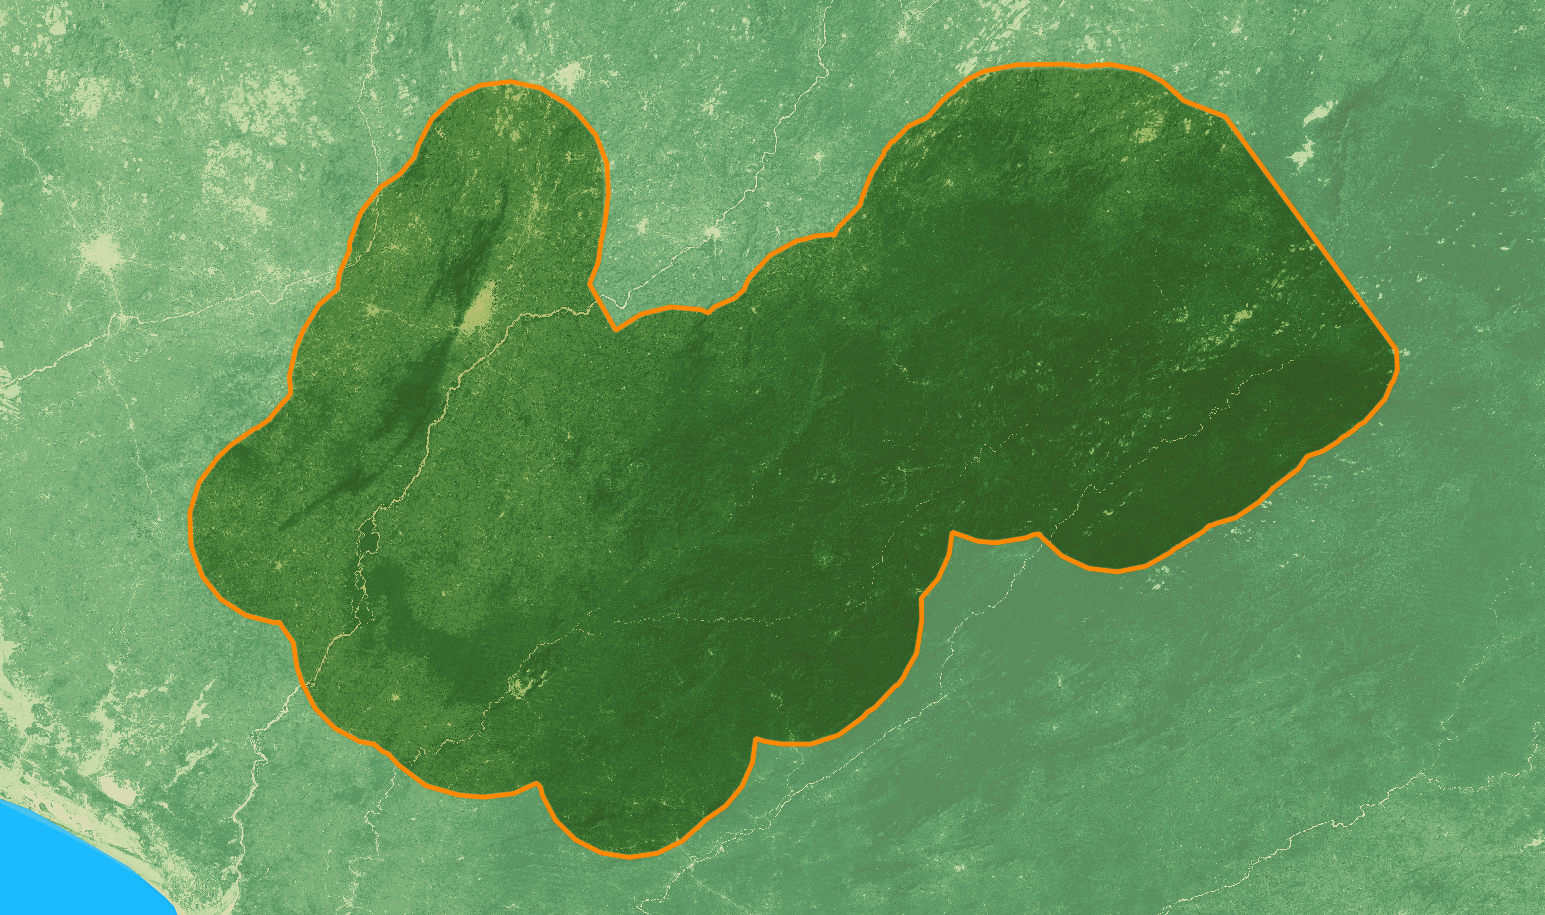
Shared between Sierra Leone and Liberia, the Gola-Foya Landscape holds large expanses of primary lowland forests. It is a key area for conservation, holding over 60 threatened species including Zebra Duiker, Western Red and Western Pied Colobuses, Forest Elephants and Chimpanzees.
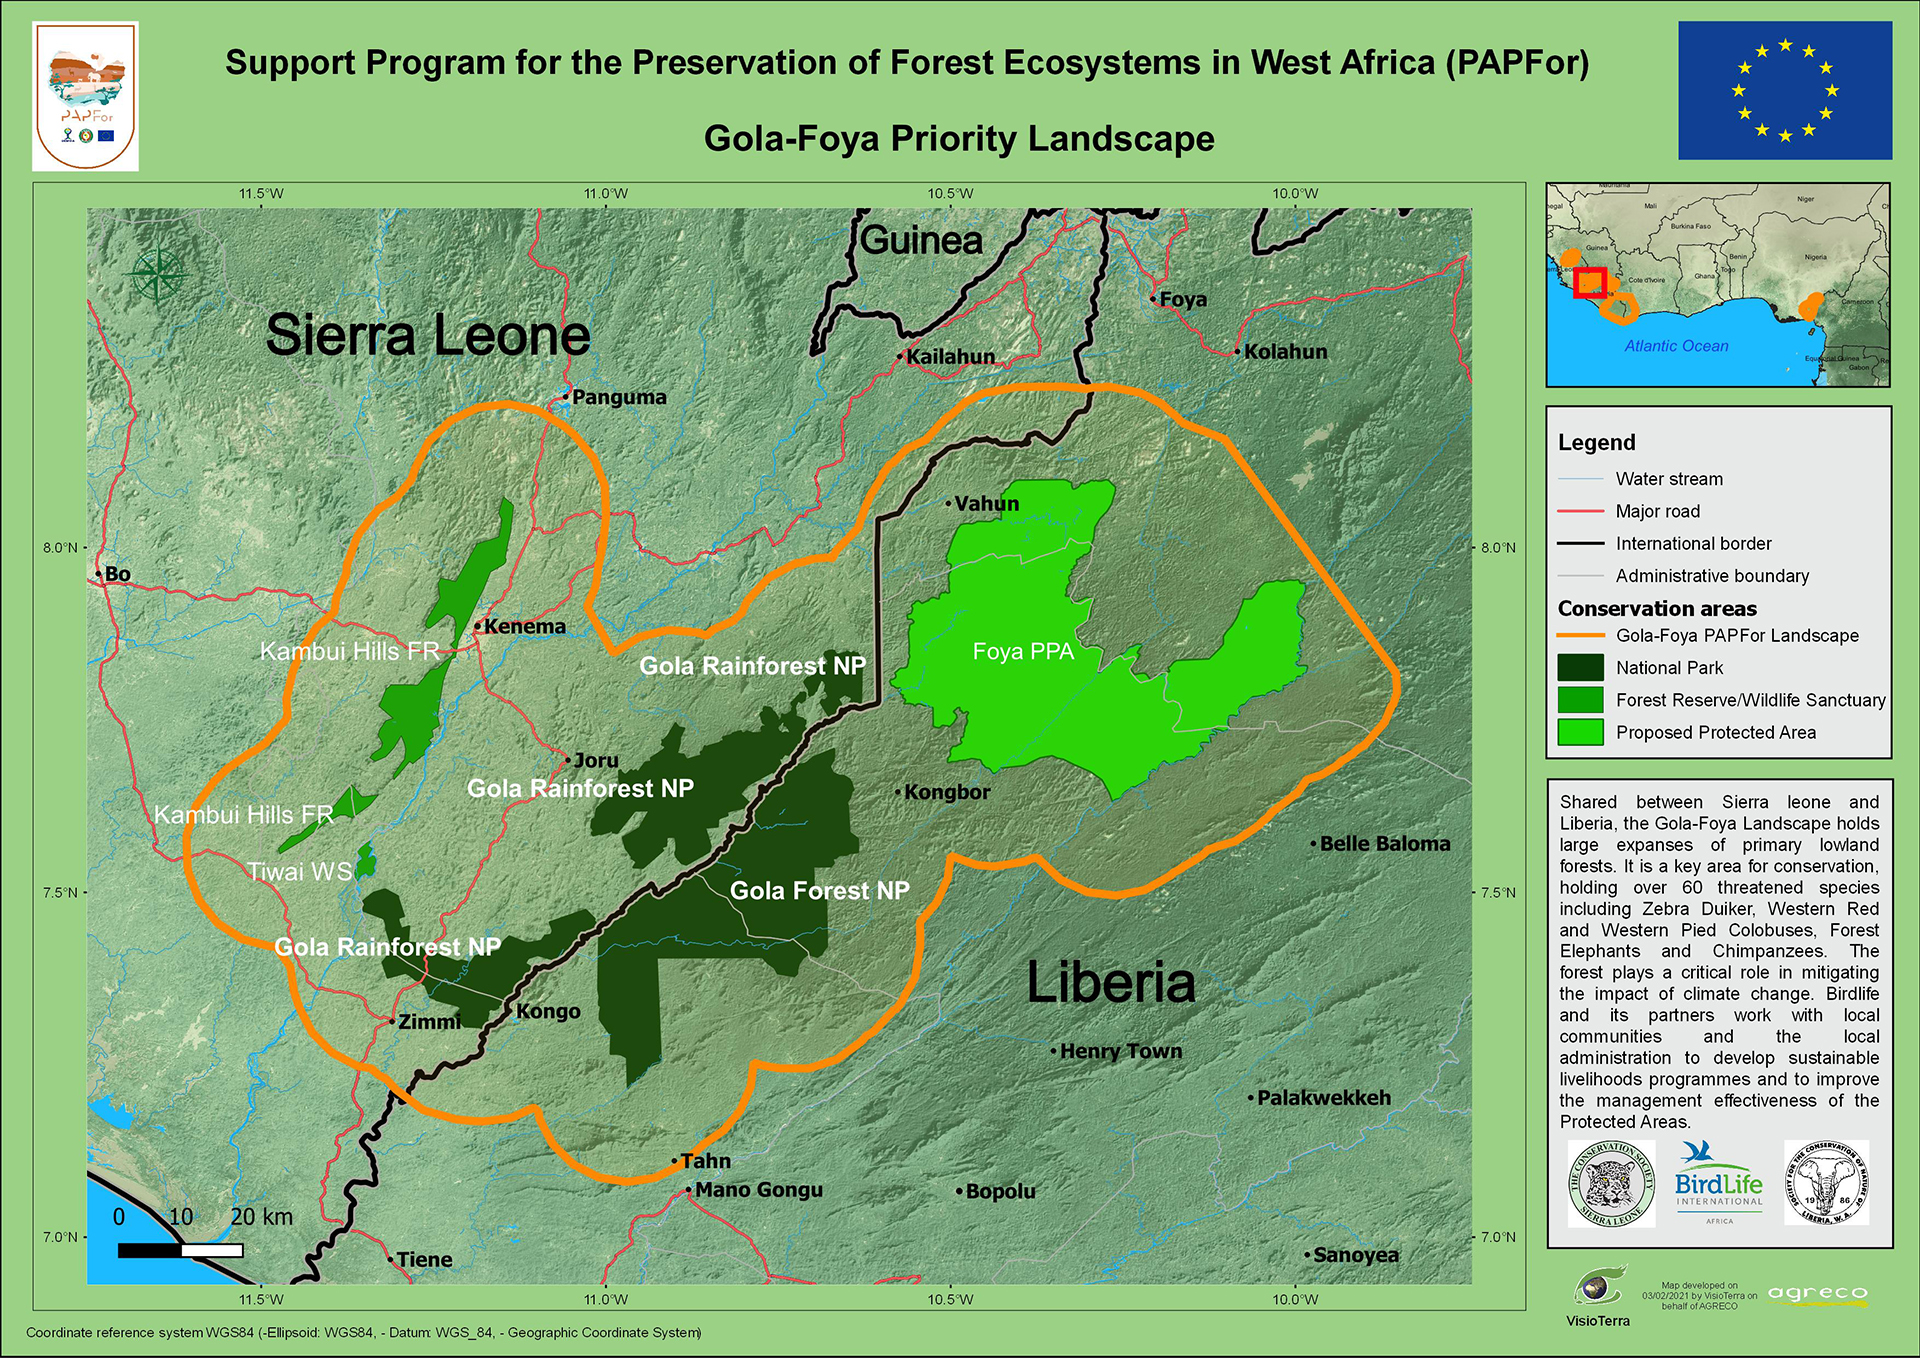
The forest plays a critical role in mitigating the impact of climate change. Birdlife and its partners work with local communities and the local administration to develop sustainable livelihoods programmes. and to improve the management effectiveness of the Protected Areas.
The landscape encompasses Gola Rainforest National Park, Gola Forest National Park, Kambui Hills Forest Reserve, Tiwai Wildlife Sanctuary and the Proposed Protected Area of Foya.
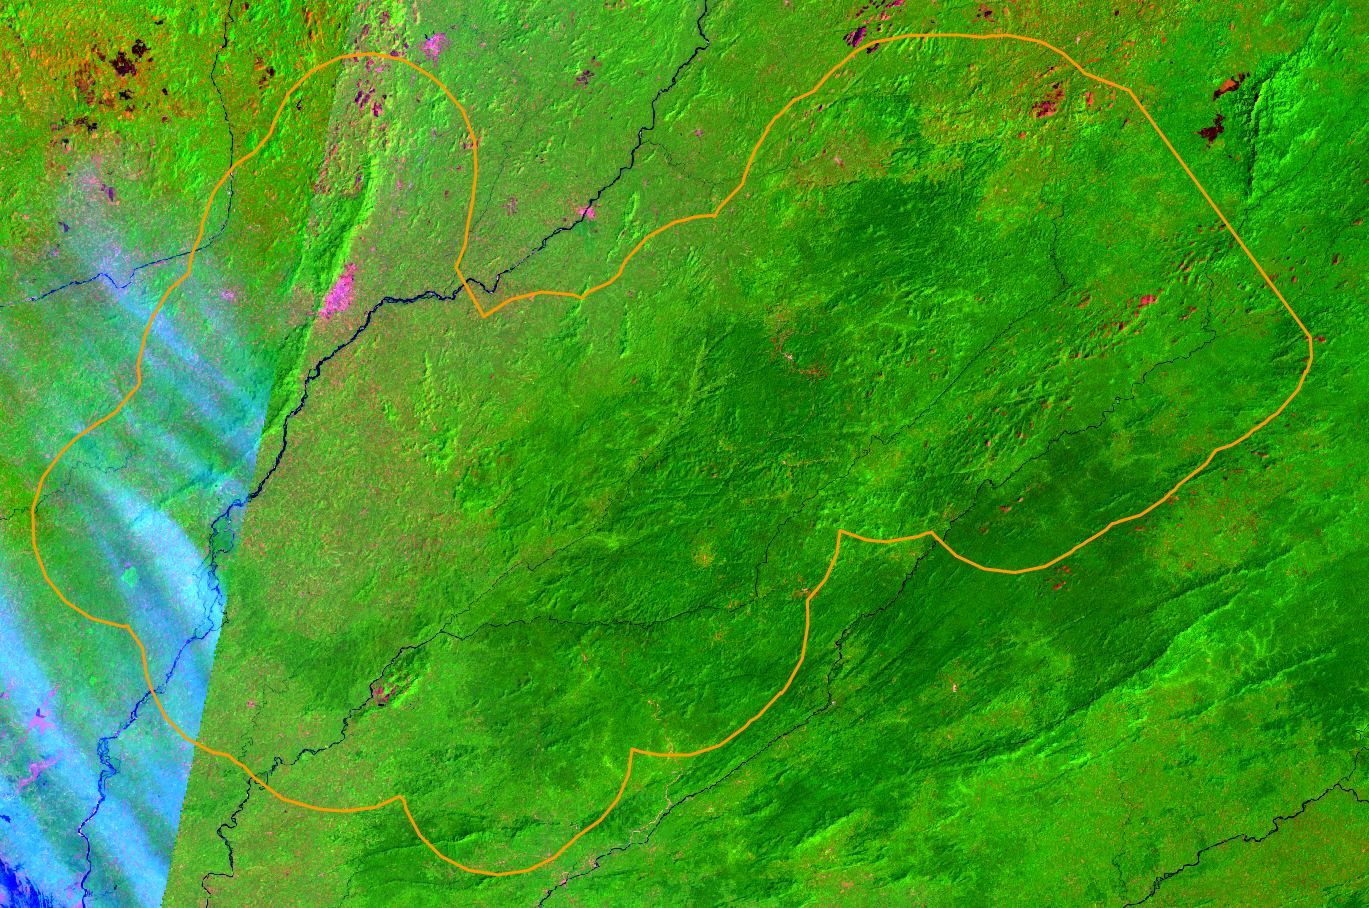
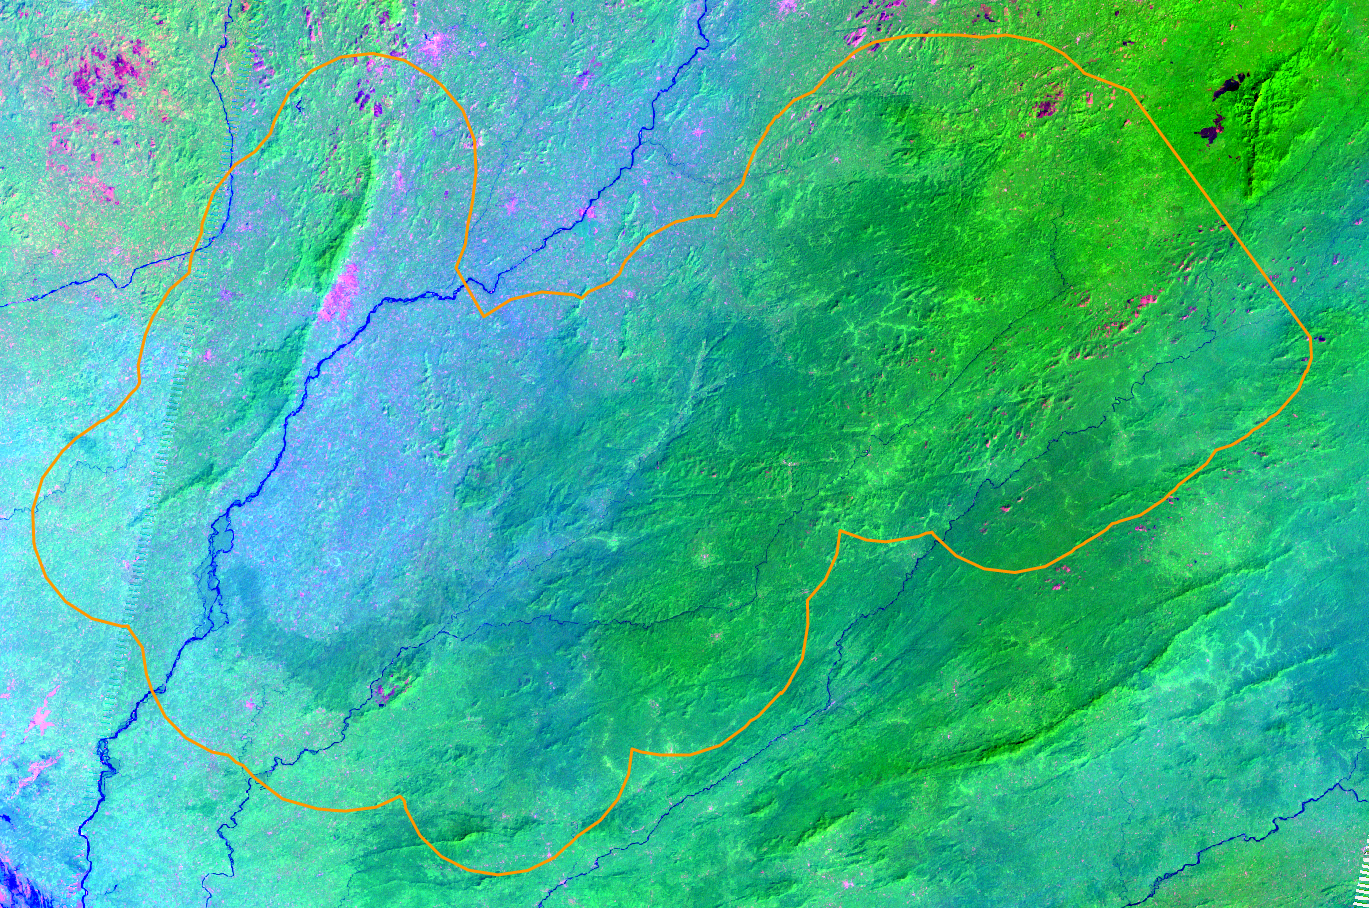
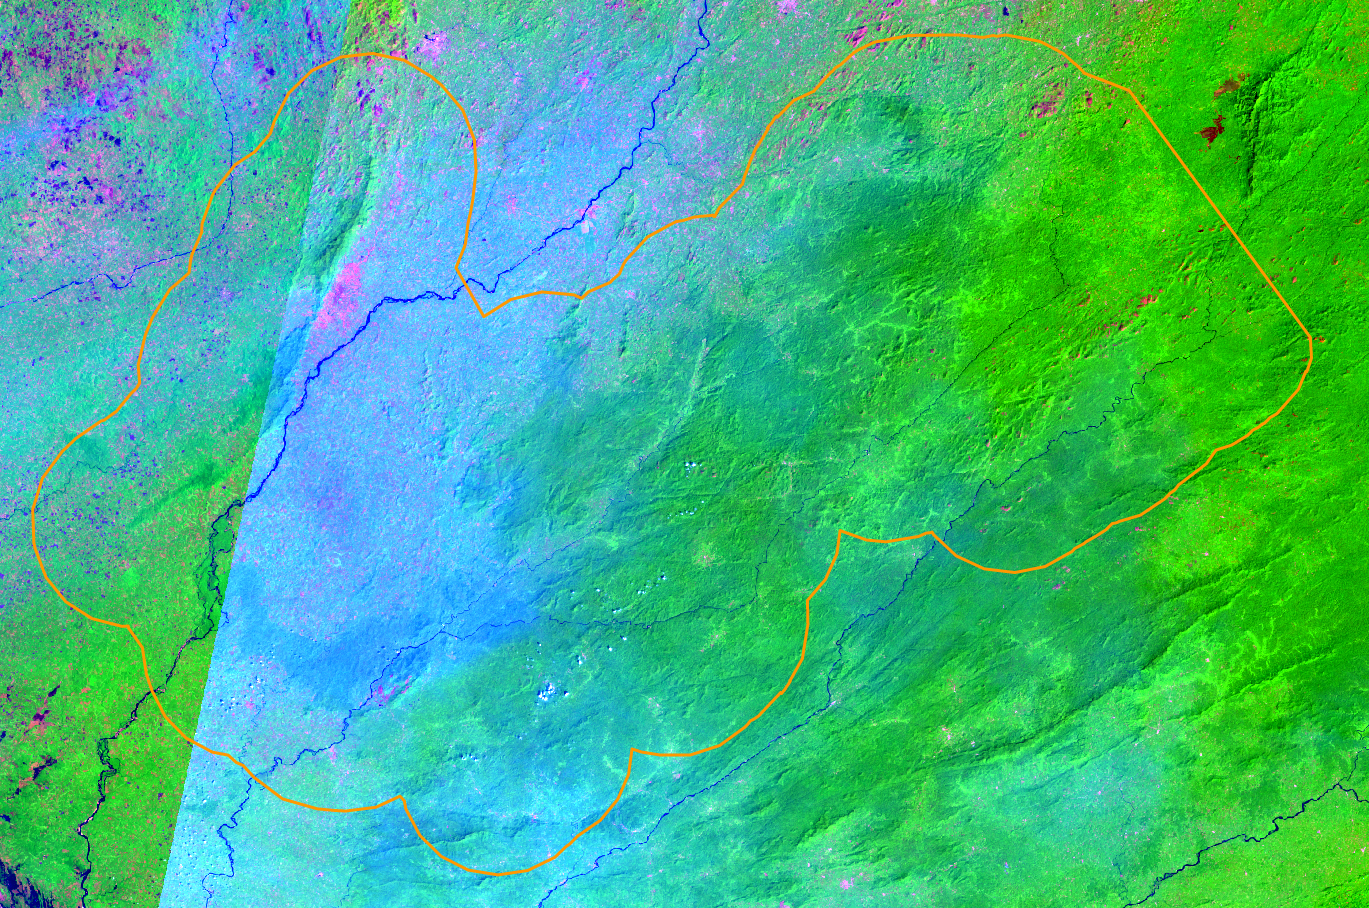
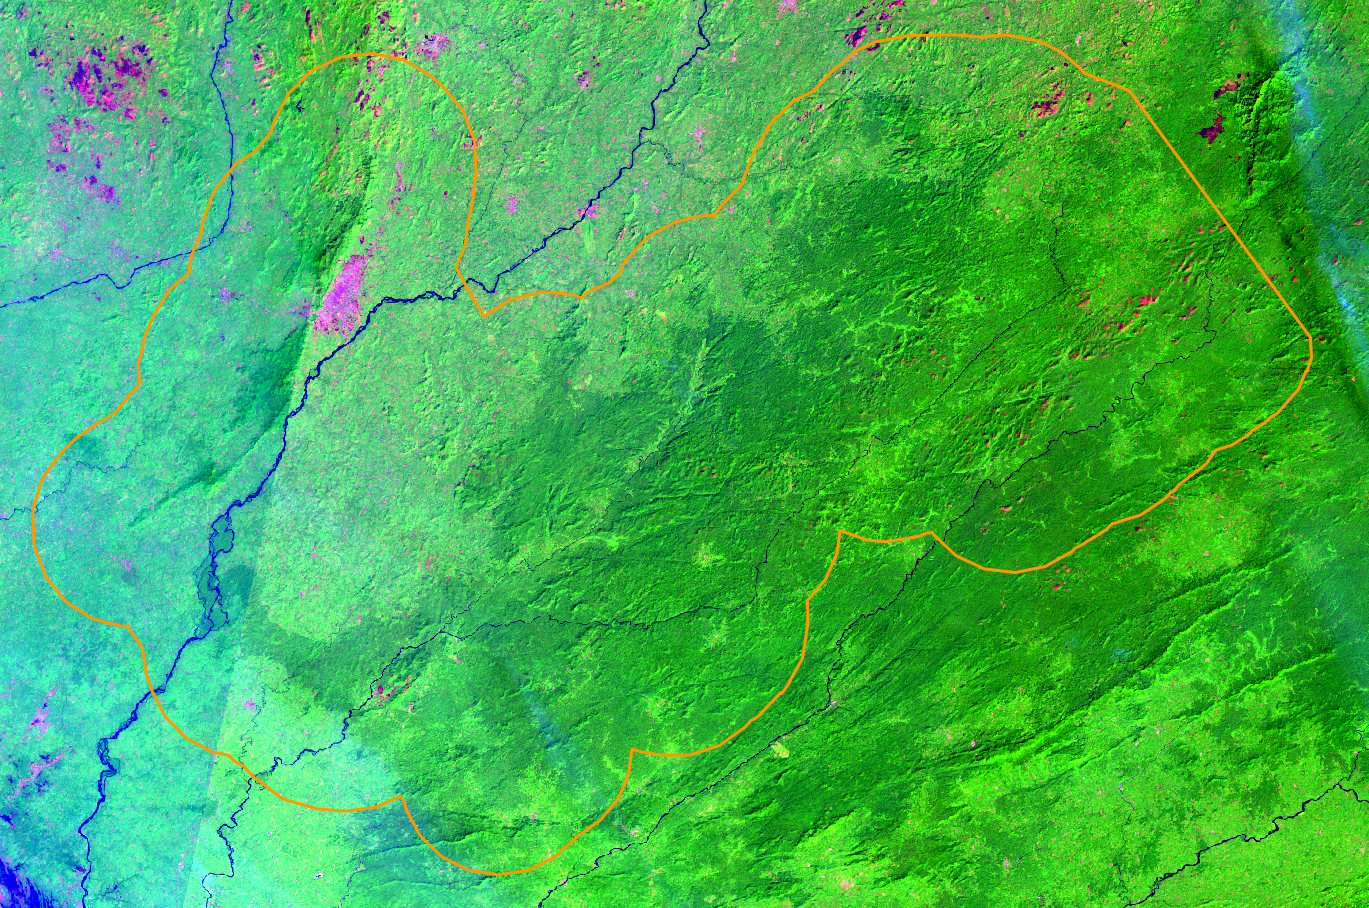
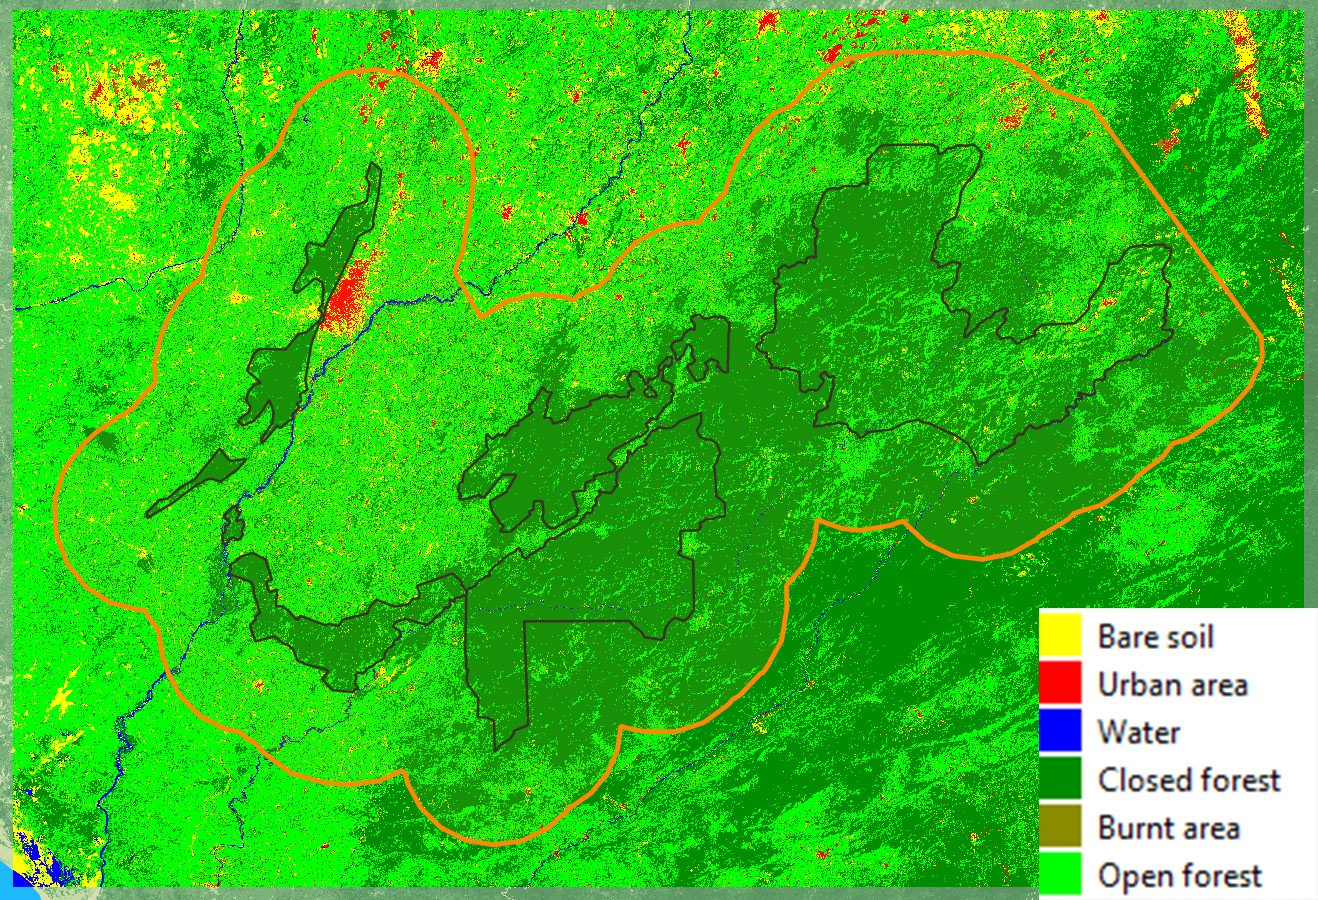
This page shows the evolution of land cover in the landscape between 2001 and 2020 using Landsat-5/7/8 optical satellite images. The page also gives examples of deforestation, active fires and burnt areas detected by the Sentinel satellites of the European program Copernicus.
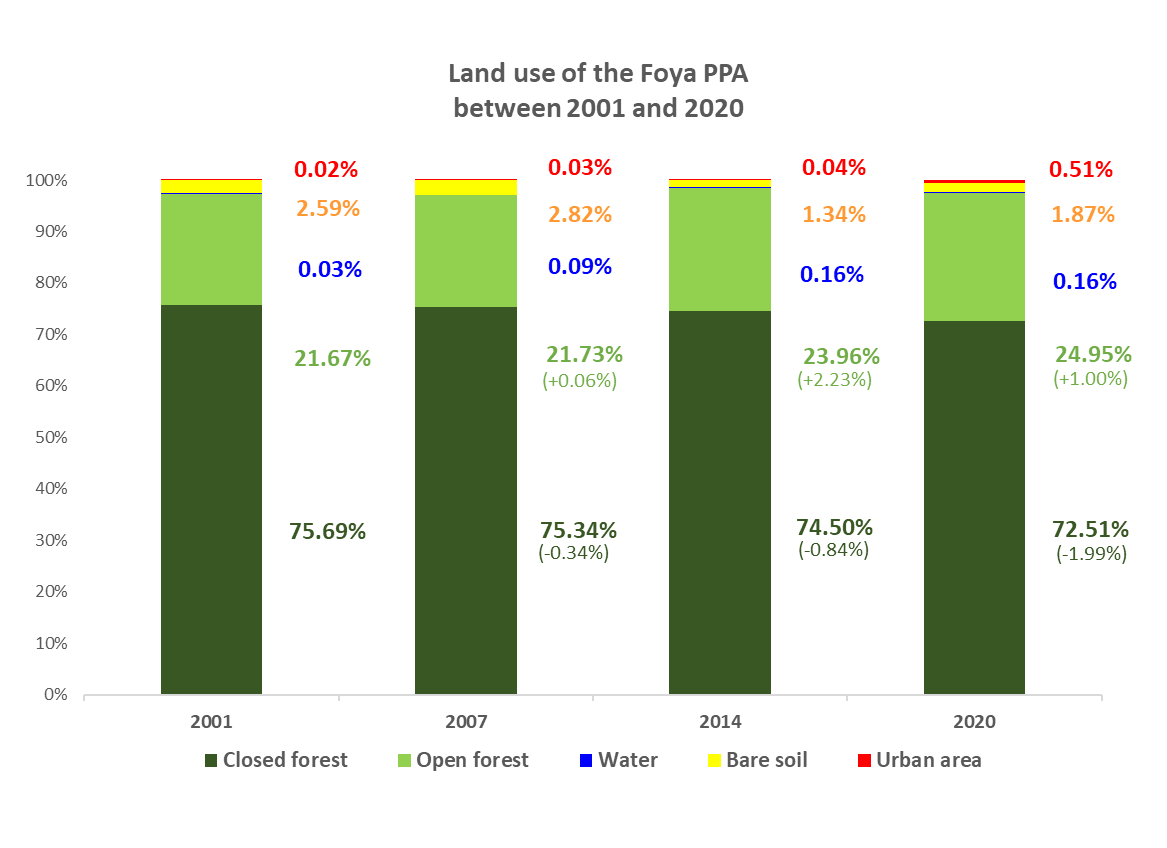
Land use in Gola-Foya between 2001 and 2020
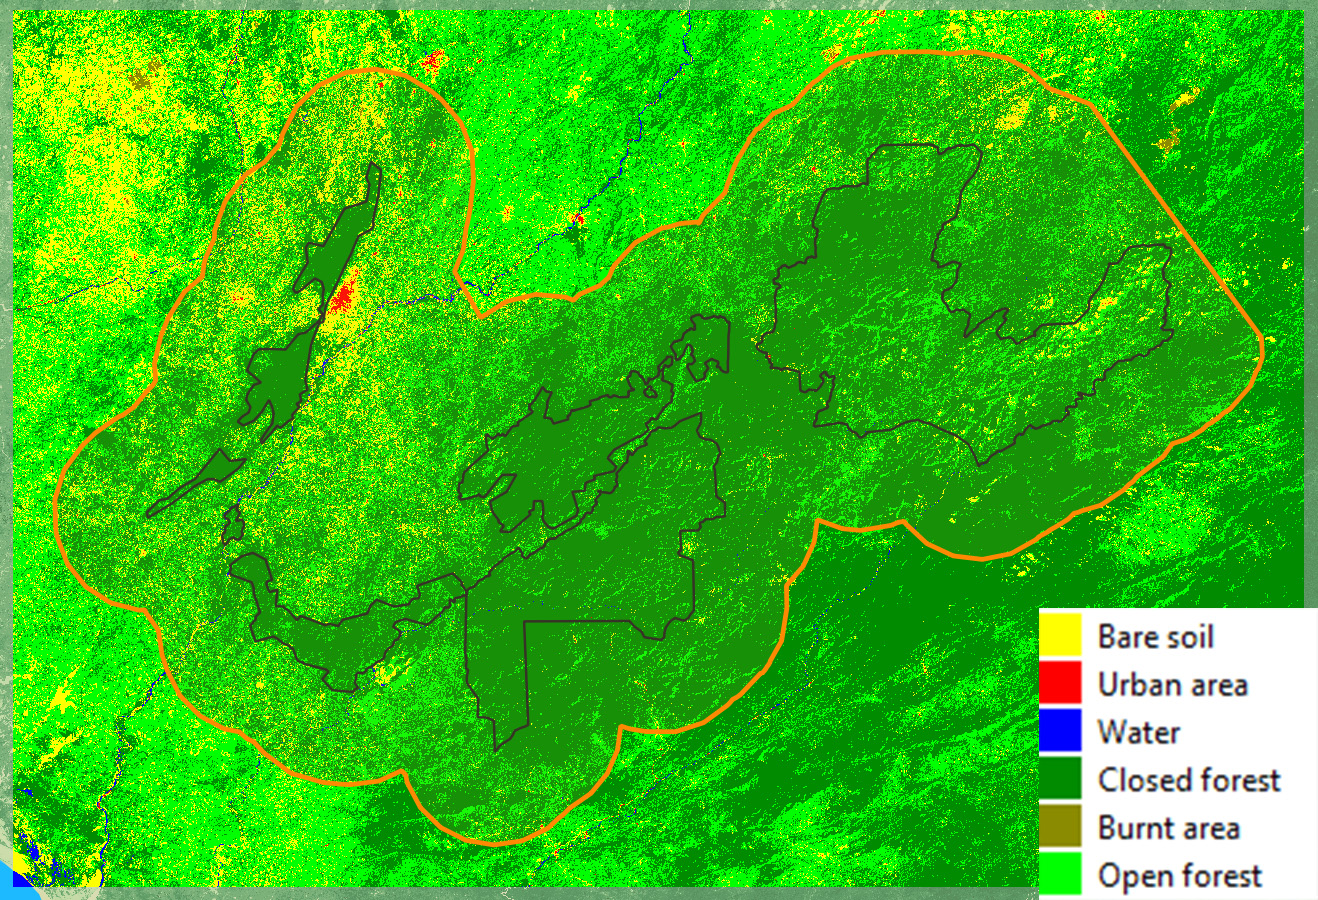
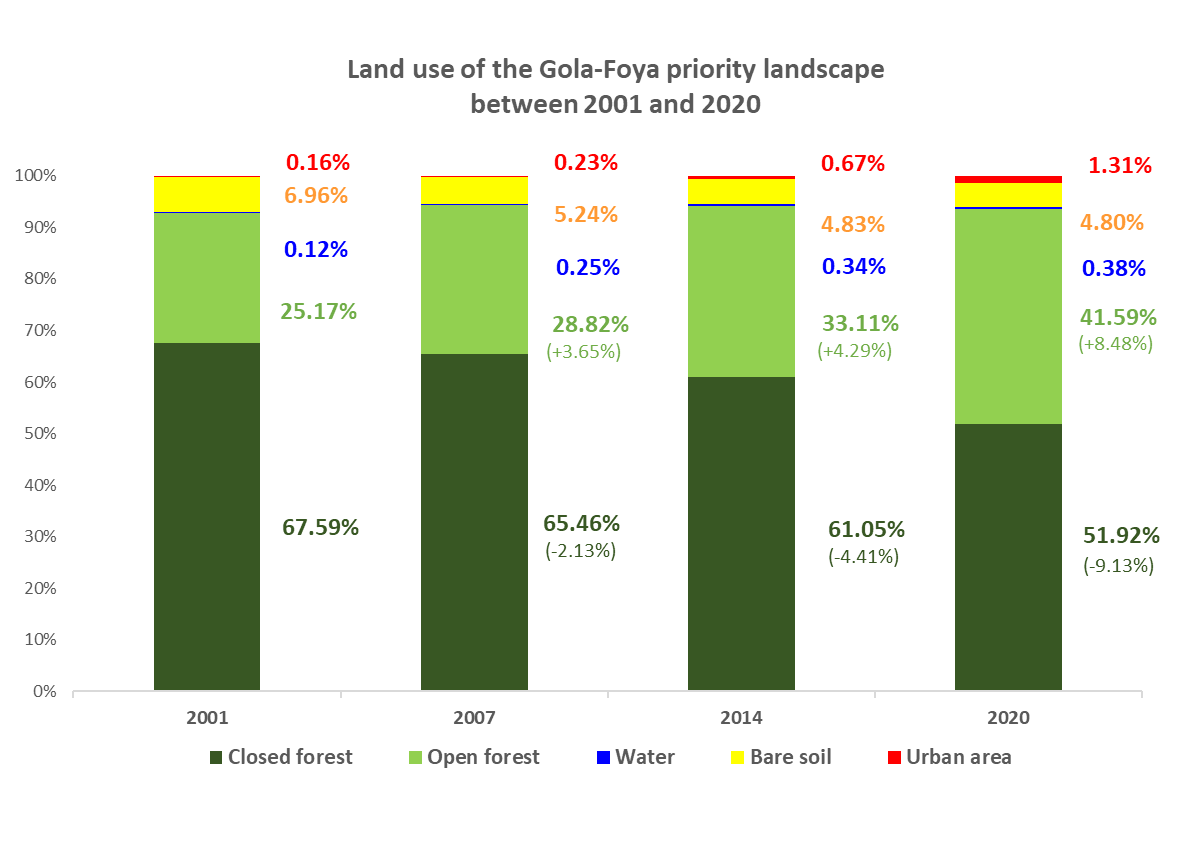
The figure above shows the evolution of the different land use classes in the priority landscape of Gola-Foya from 2001 to 2020
It can be seen that the forest cover underwent a gradual degradation between 2001 and 2020. This growth follows an exponential law of a factor 2. We observe a loss of 2.13% during the period 2001-2007, a loss of 4.41% during the period 2007 2014 and a loss of 9.13% during the 2014-2020 period.
Urban expansion is also growing exponentially with statistics of 0.16% (2001), 0.23% (2007), 0.67% (2014) and 1.31% (2020).
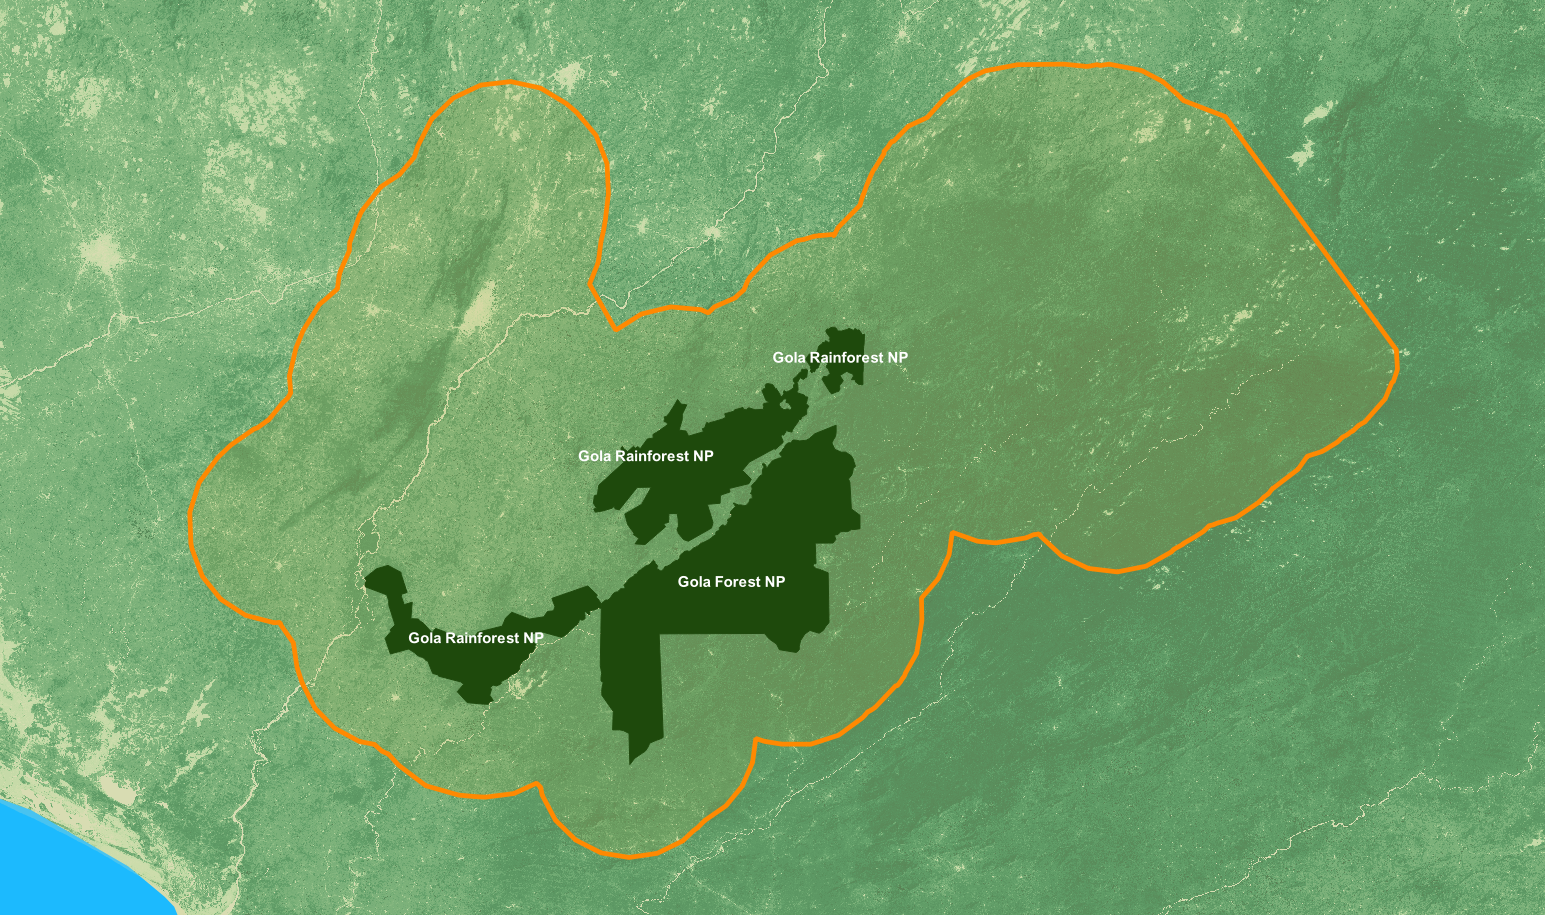
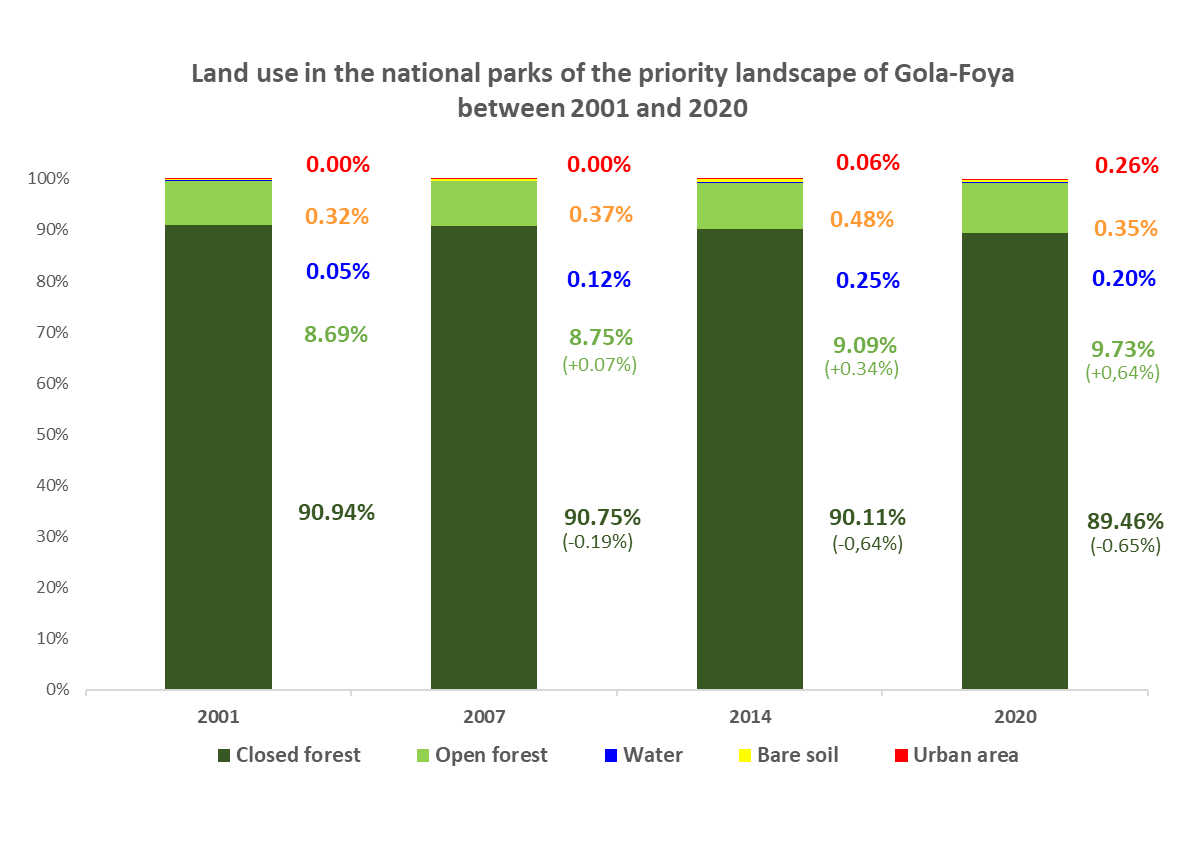
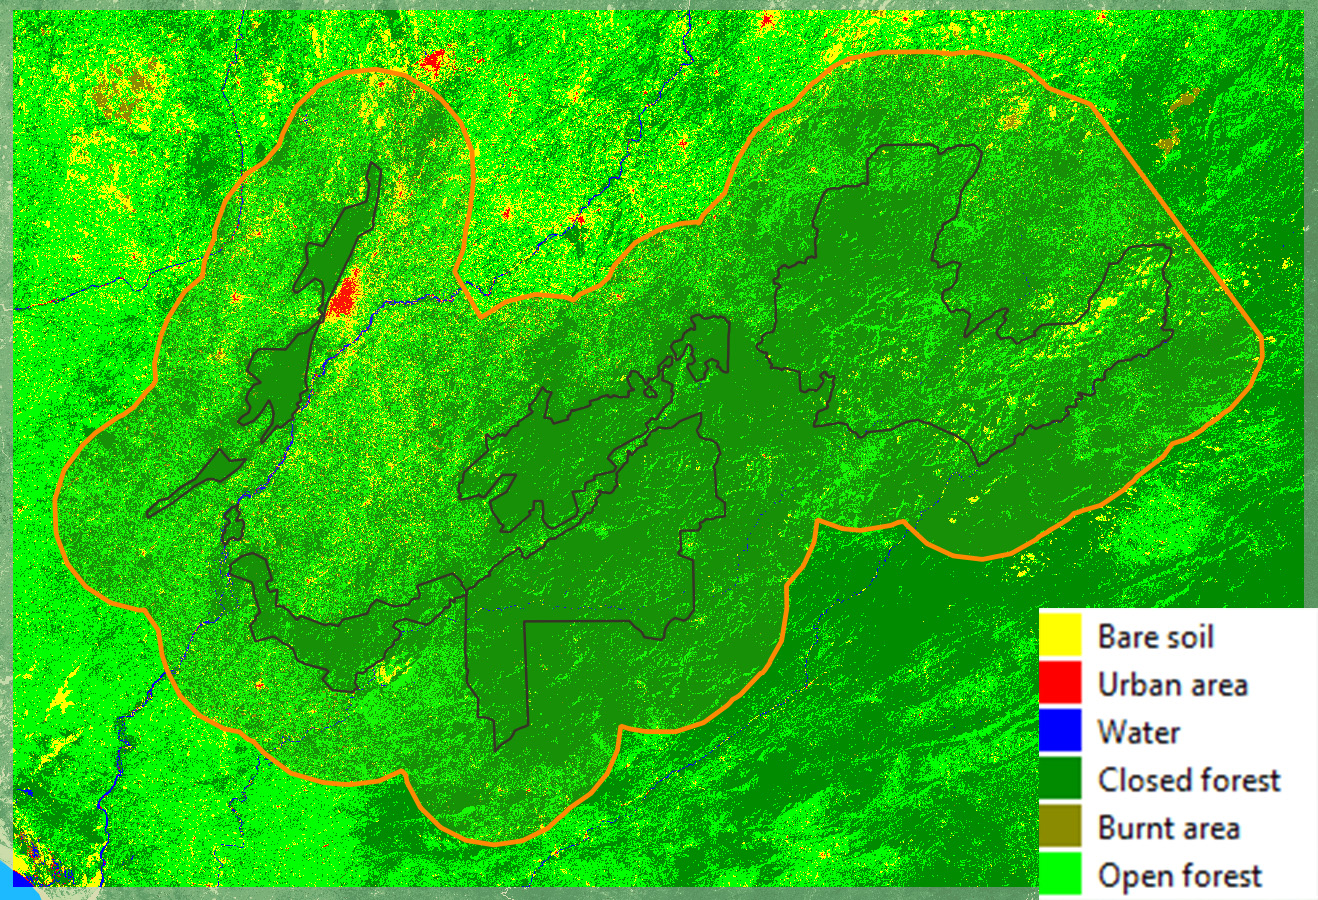
The figure above shows the evolution of the different land use classes in the two national parks (Gola Rainforest National Park and Gola Forest National Park) of the priority landscape of Gola-Foya (Fig.9) between 2001 and 2020
These national parks are mainly occupied by forests (around 90%).
We can see that this forest cover was preserved between 2001 and 2020 with low losses of: 0.19% during the period 2001-2007, 0.64% during the period 2007-2014 and 0.65% during the period 2014-2020.
However, there are some recent human settlements in Gola Forest National Park.
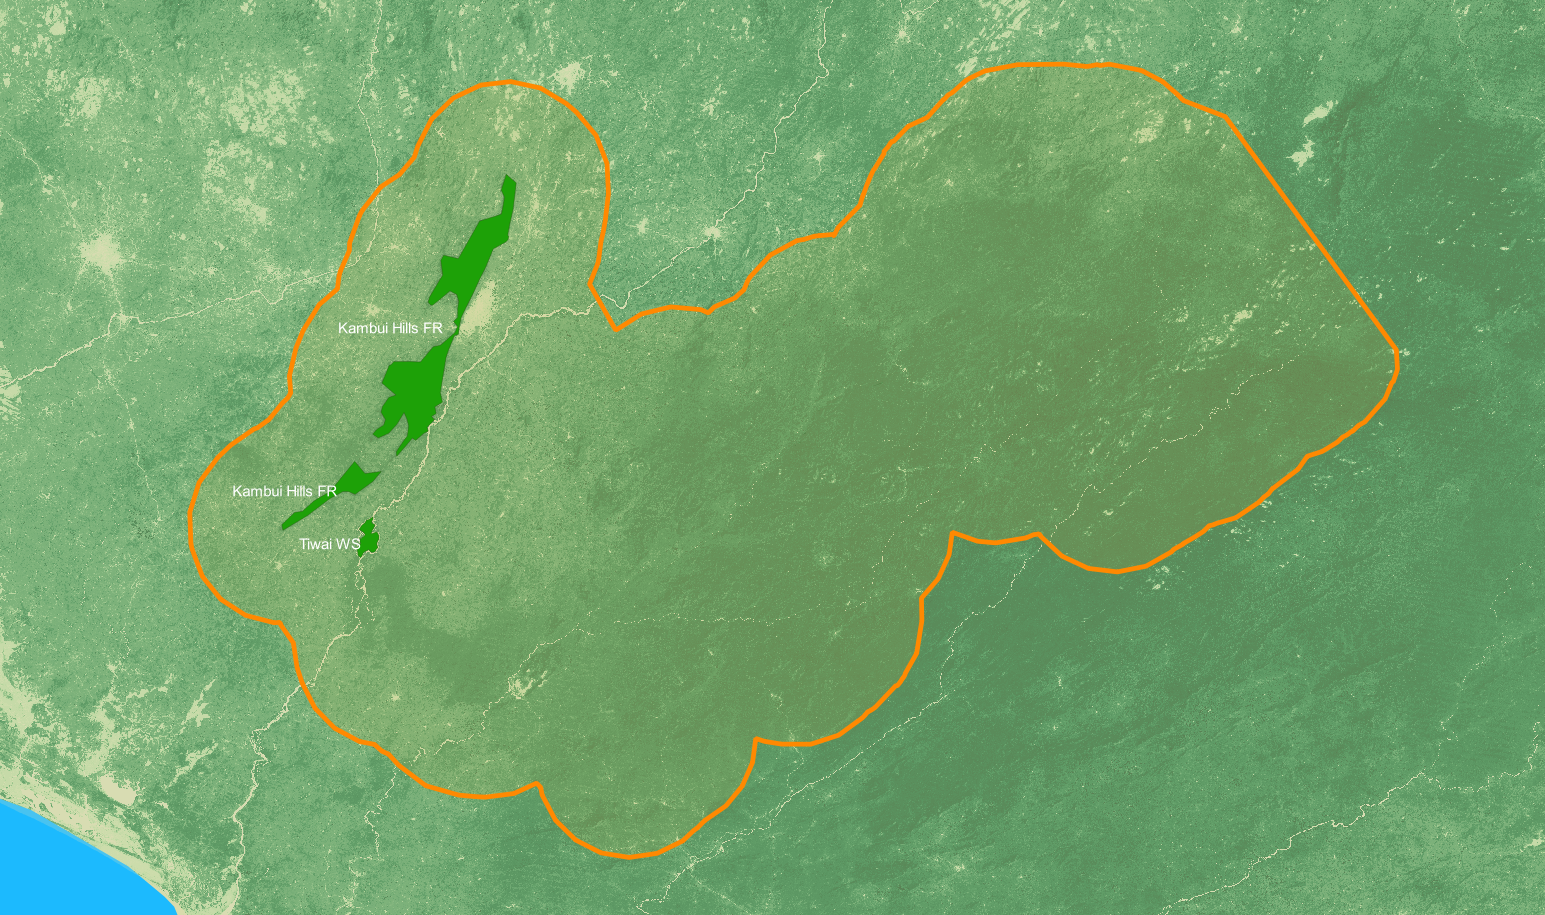
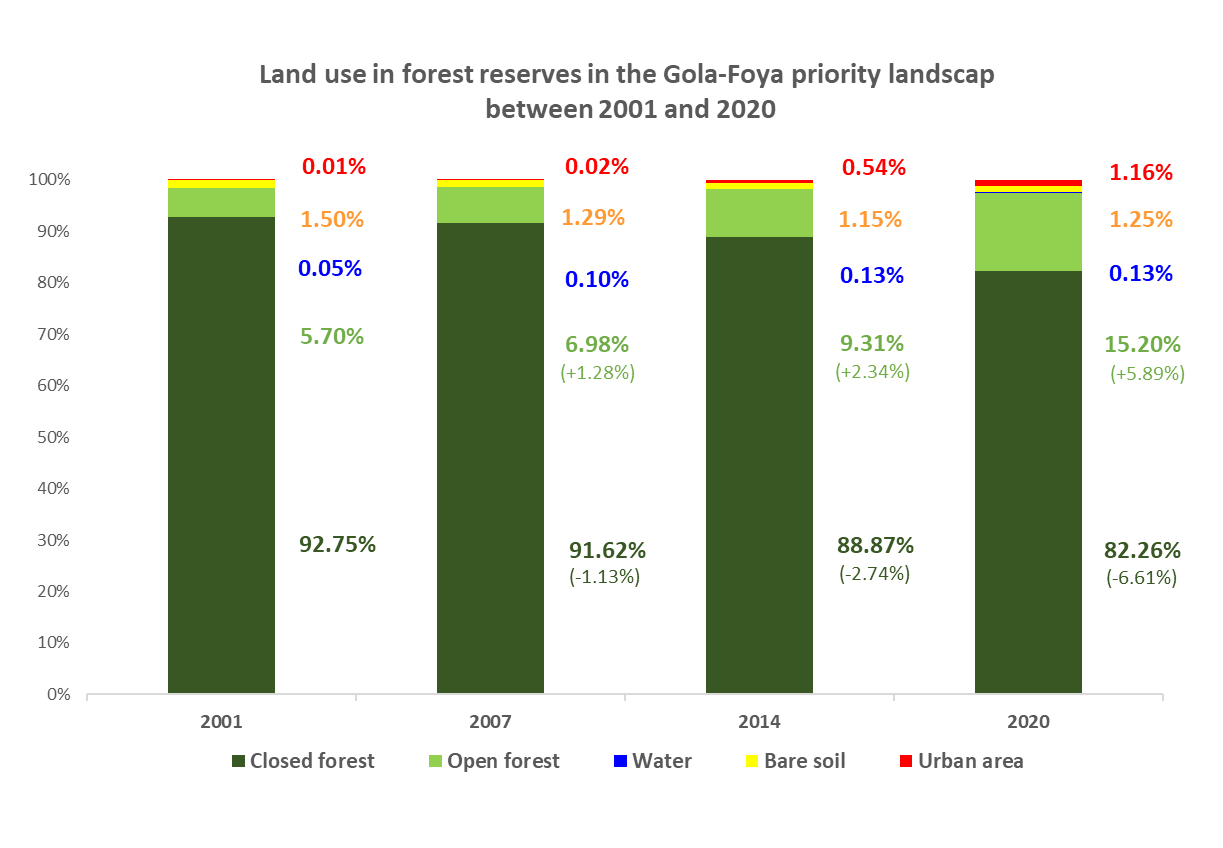
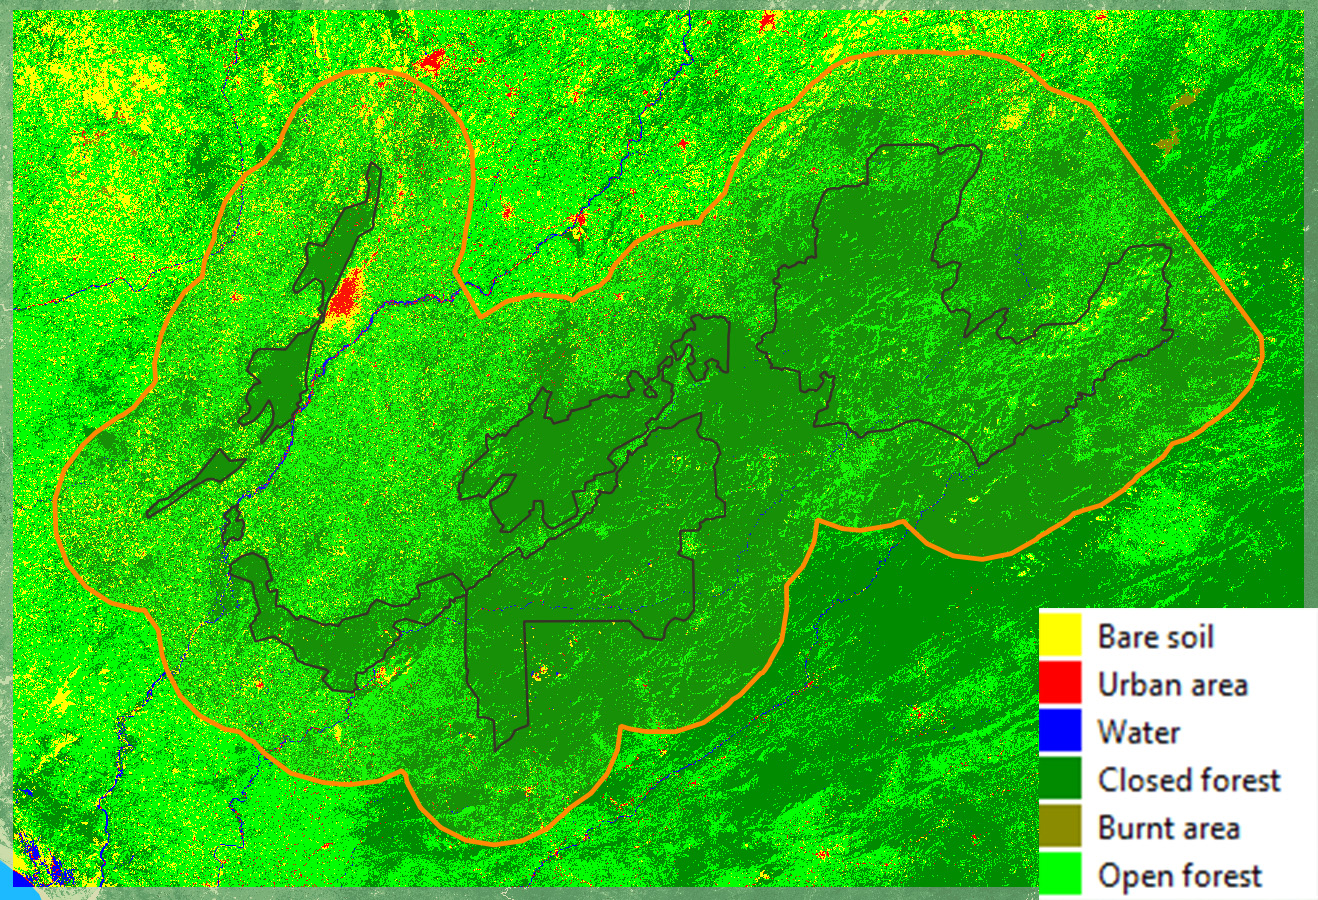
The figure above shows the evolution of the different land use classes in the Kambui Hills Forest Reserve and the Tiwai Wildlife Sanctuary of the Gola-Foya Priority Landscape between 2001 and 2020.
These forest reserves are also mainly occupied by forests (around 90%).
We can see that the forest cover underwent a gradual degradation between 2001 and 2014 with an acceleration between 2014 and 2020. Indeed, the forest cover losses amount to 1.13% during the period of 2001-2007, 2.74% during the period. period 2007 2014 and 6.61% during the period 2014-2020.
These losses are more pronounced than those observed in national parks.
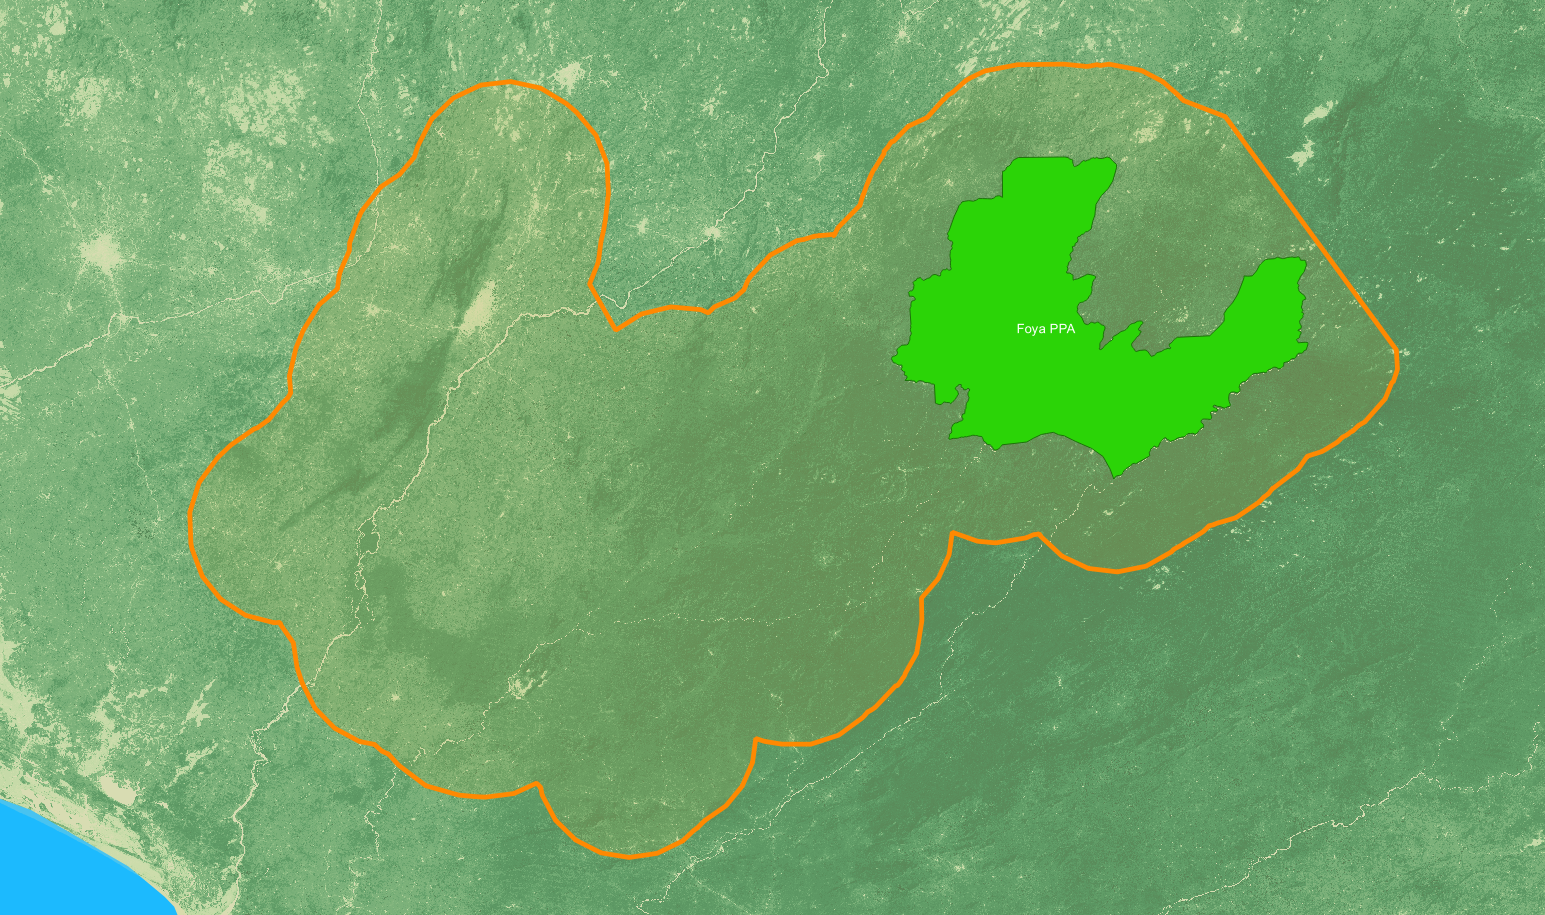
14 shows the evolution of the different classes of land use in the proposed protected area of Foya in the priority landscape of Gola-Foya between 2001 and 2020.
Compared to national parks and forest reserves for which forest accounted for about 90% of their total area, the proposed protected area of Foya offers about 75% less forest cover.
We can see that this forest cover was rather preserved between 2001 and 2020 with relatively low losses of: 0.34% during the period 2001-2007, 0.84% during the period 2007-2014 and 1.99% during the period 2014-2020.
There is also growing human activity, as evidenced by the urban area class in 2020.
Loss of forest cover in the different conservation units between 2001 and 2020
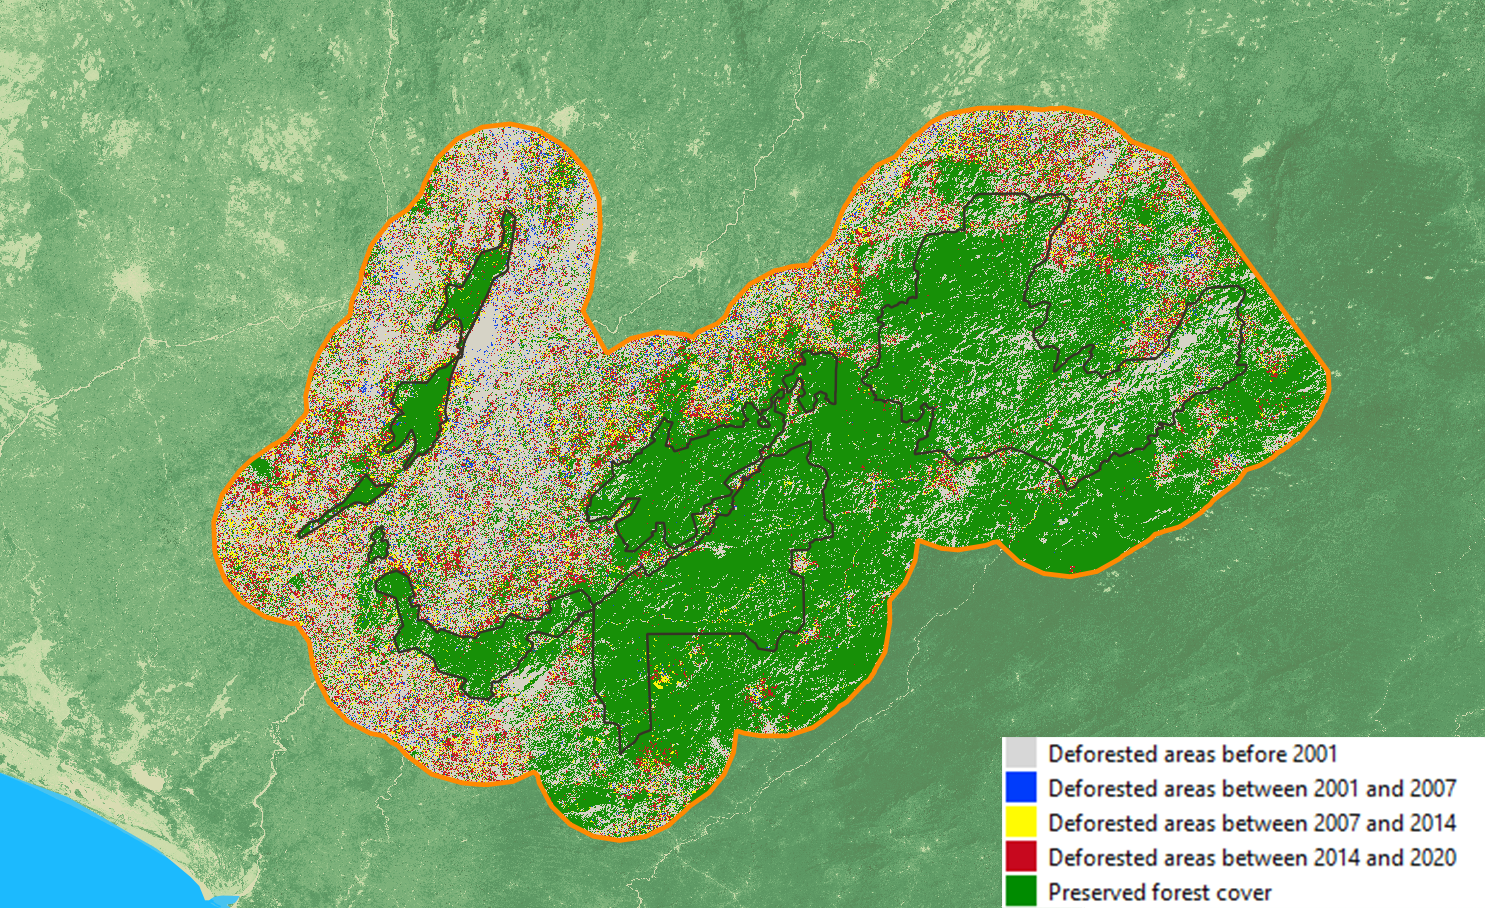
The figure above shows deforestation by period throughout the Gola-Foya priority landscape. The areas in gray represent the areas deforested before 2001, the areas in blue are those deforested between 2001 and 2007, the areas in yellow are those deforested between 2007 and 2014 and the areas in red are those deforested between 2014 and 2020. This red dominant testifies to the acceleration of deforestation in the last period.
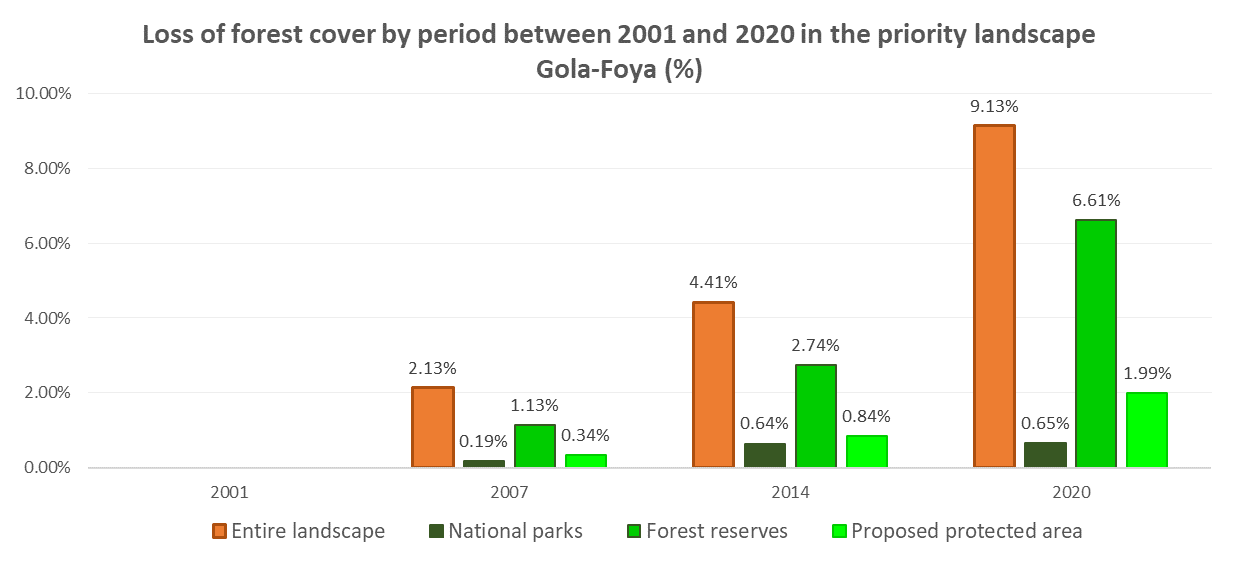
The figure above shows the evolution of forest cover loss by period in the four conservation units: entire landscape, national parks, forest reserves and proposed protected area.
It can be seen that national parks have been preserved while forest reserves have suffered an increasing loss of their forests.
Fire detection
A novel algorithm automatically detects active fire fronts from Sentinel-2 optical data.
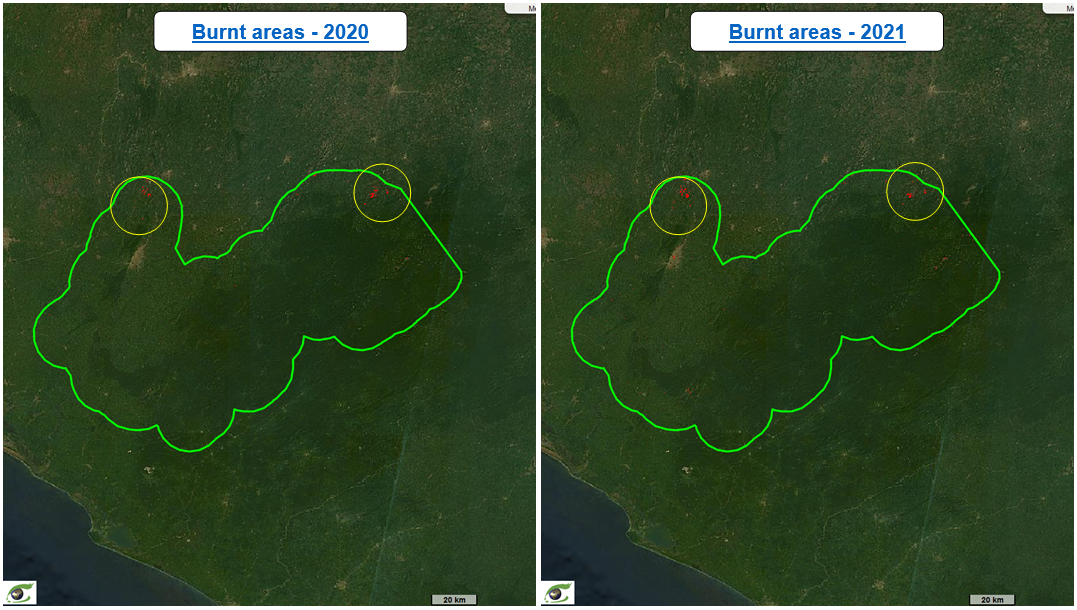
Burnt areas – Periodic bulletin
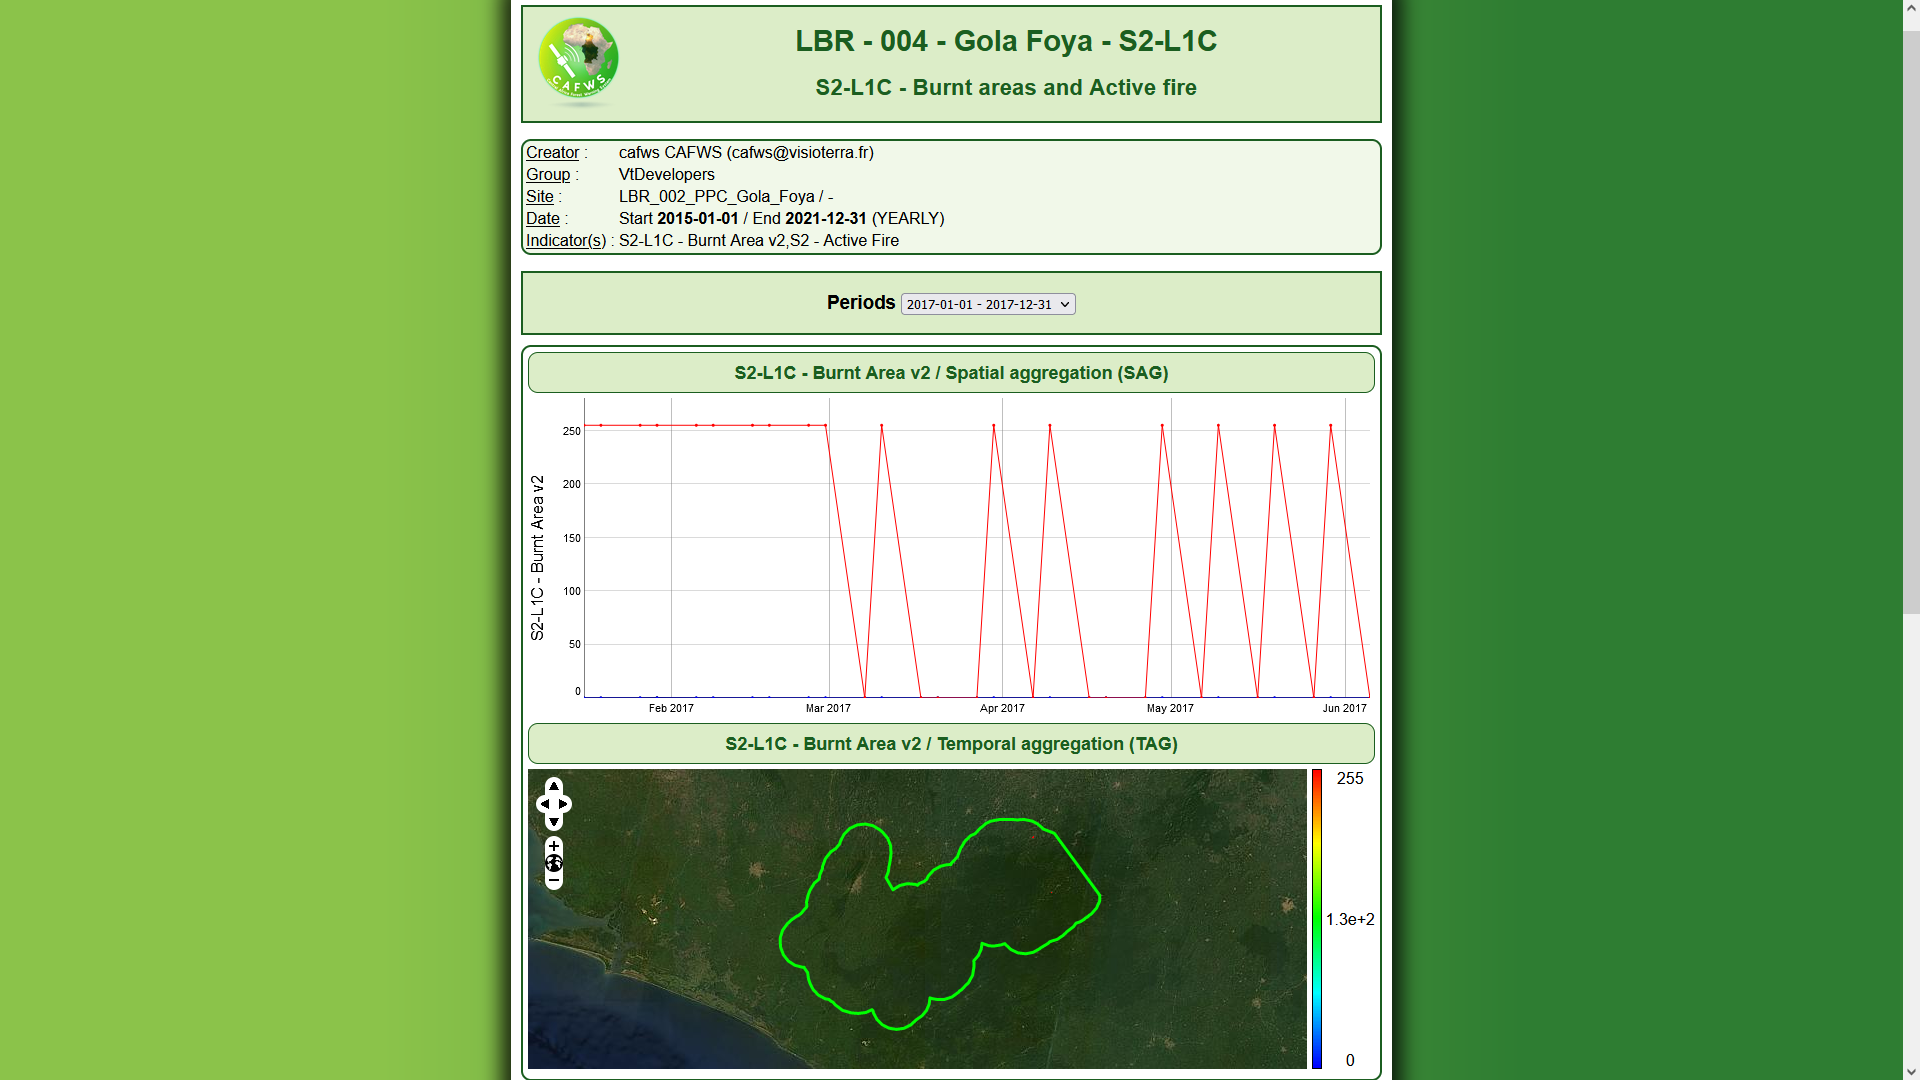
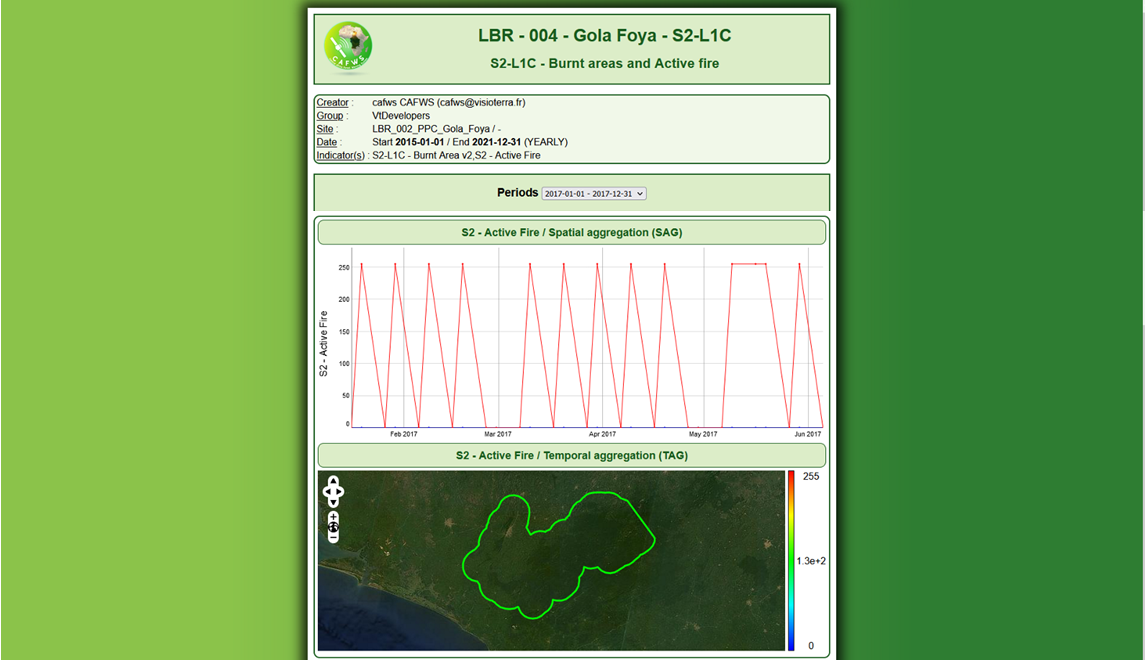
The figure shows the periodic bulletin generated by a geoservice monitoring burned areas and active fires in the Gola-Foya priority landscape between 2015 and 2021. This periodic bulletin was produced by the CAFWS platform developed by VisioTerra. The first and second sections of the periodic bulletin provide information on the name of the geoservice, the site, the indicator(s) to be calculated (active fires, burnt areas, etc.) and the period of time during which the geoservice will operate. The third section allows the user to choose the period for which the results are to be displayed (the period here is annual). The fourth section concerns the results of the spatial aggregation of burned areas. The red curve shows the presence (value 255 on the y-axis) or absence (value 0 on the y-axis) of burned area in the study area during the defined period. The fifth section shows the results of the temporal aggregation of burned areas. The areas where a burnt area was detected at least once during the study period are rendered in red. Here, for example (Fig.23), the burned areas are those detected in 2017.

The Fig.25 shows a Sentinel-2 image which exploits the richness of the spectral bands of its multispectral instrument MSI. Here, bands 11, 8 and 2 correspond to mid-infrared, near-infrared and blue. These three bands 11, 8, 2 have been assigned to the red, green and blue planes respectively. The Sentinel-2 tile (Fig.25) was acquired in the dry season on January 14, 2020.
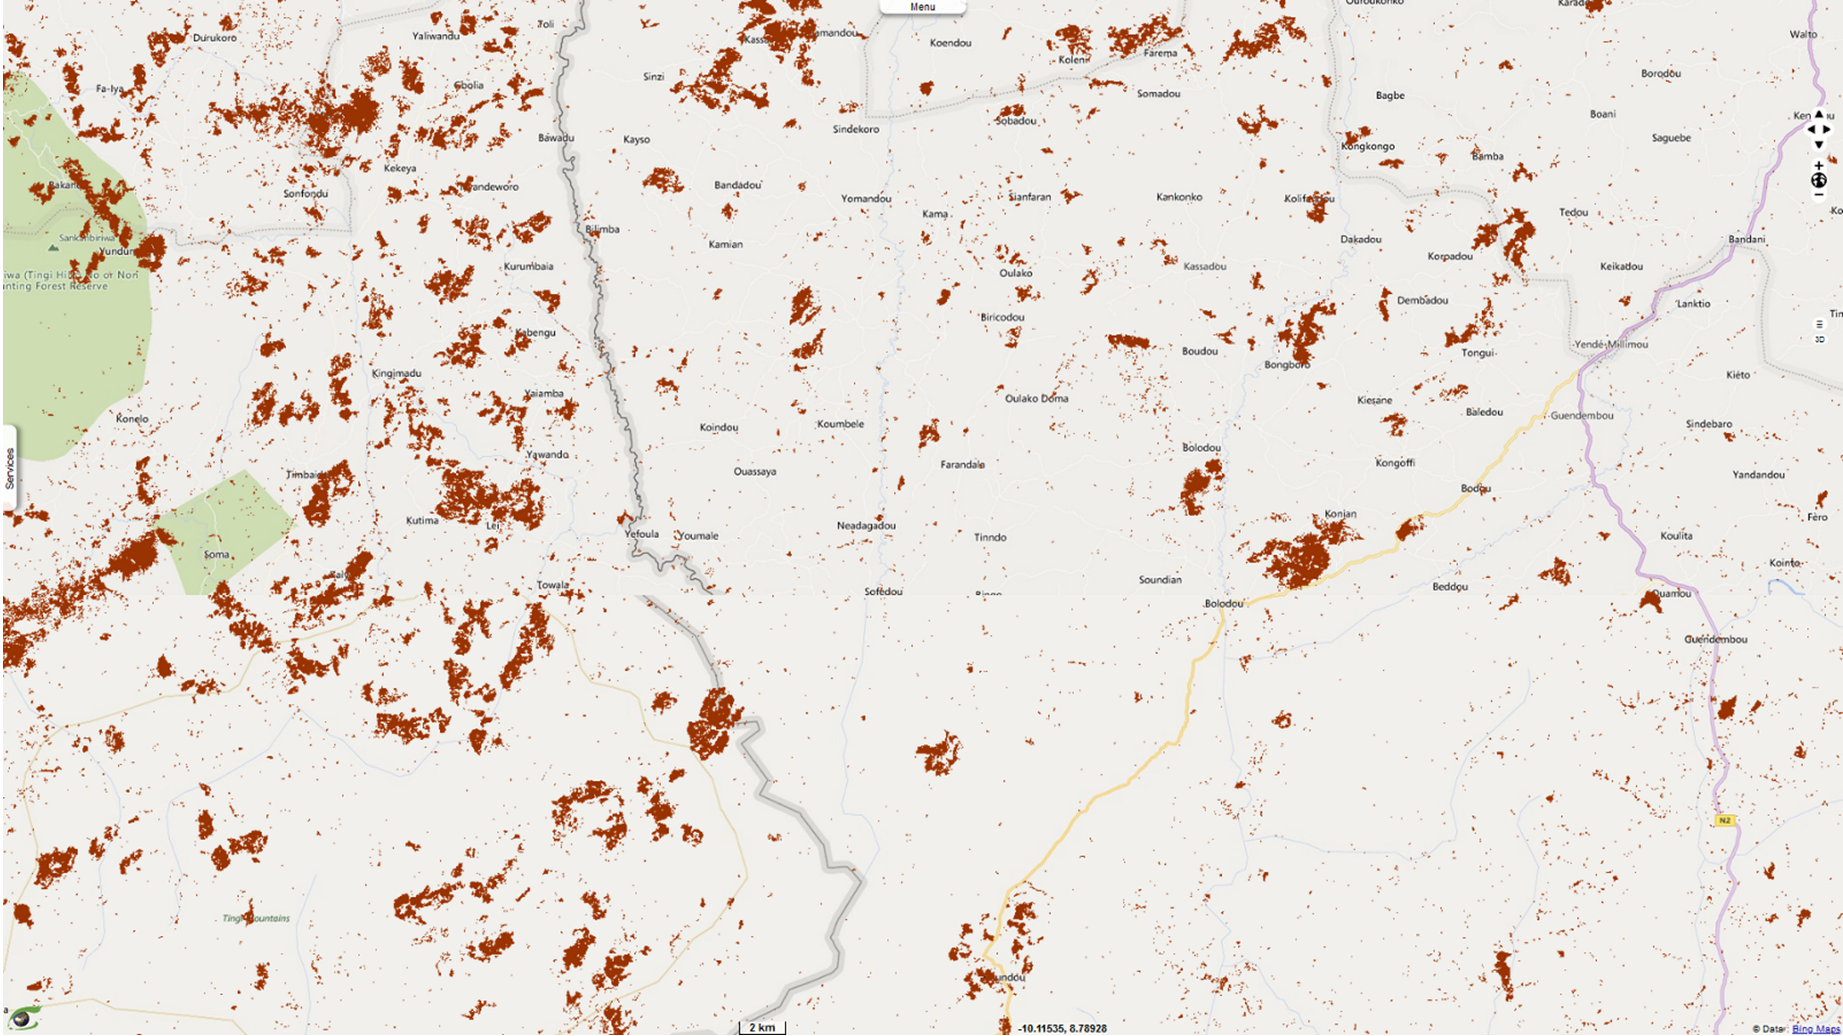
shows in brown the result of the segmentation of the burnt areas observed on the image Fig.25. From this segmentation, we can calculate the occurrences of burned areas over time as illustrated in the graph below.
Active fires – Periodic bulletin
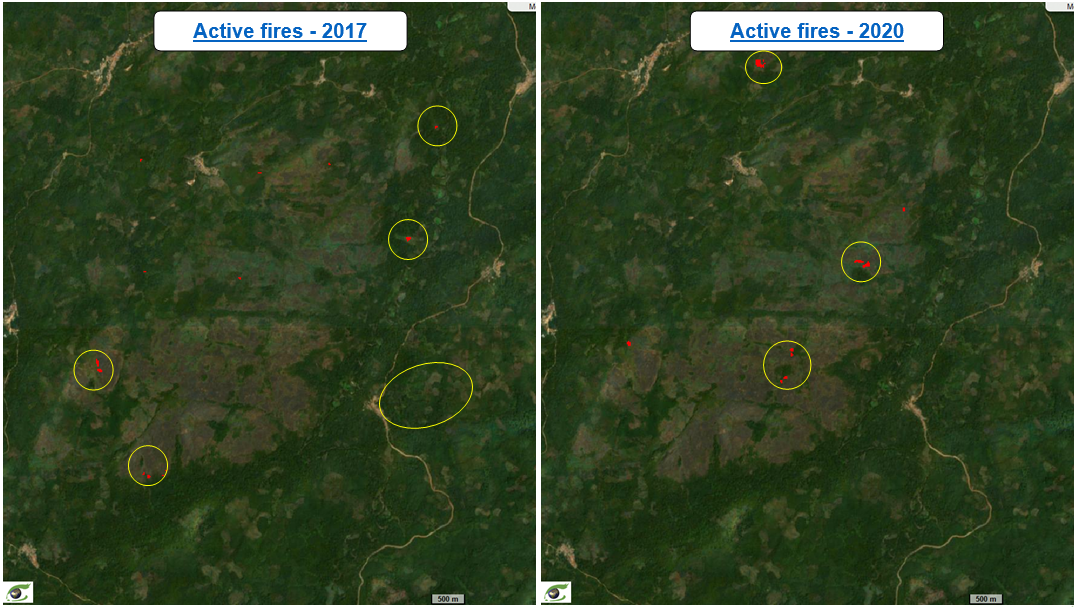
The figure shows the periodic bulletin generated by the same geoservice monitoring burnt areas and active fires in the priority landscape of Gola-Foya between. Monitoring is performed from 2015 to 2021 with the indicator of active fires. The red areas in the temporal aggregation section image represent areas where an active fire front was observed at least once during the study period.
Active fires
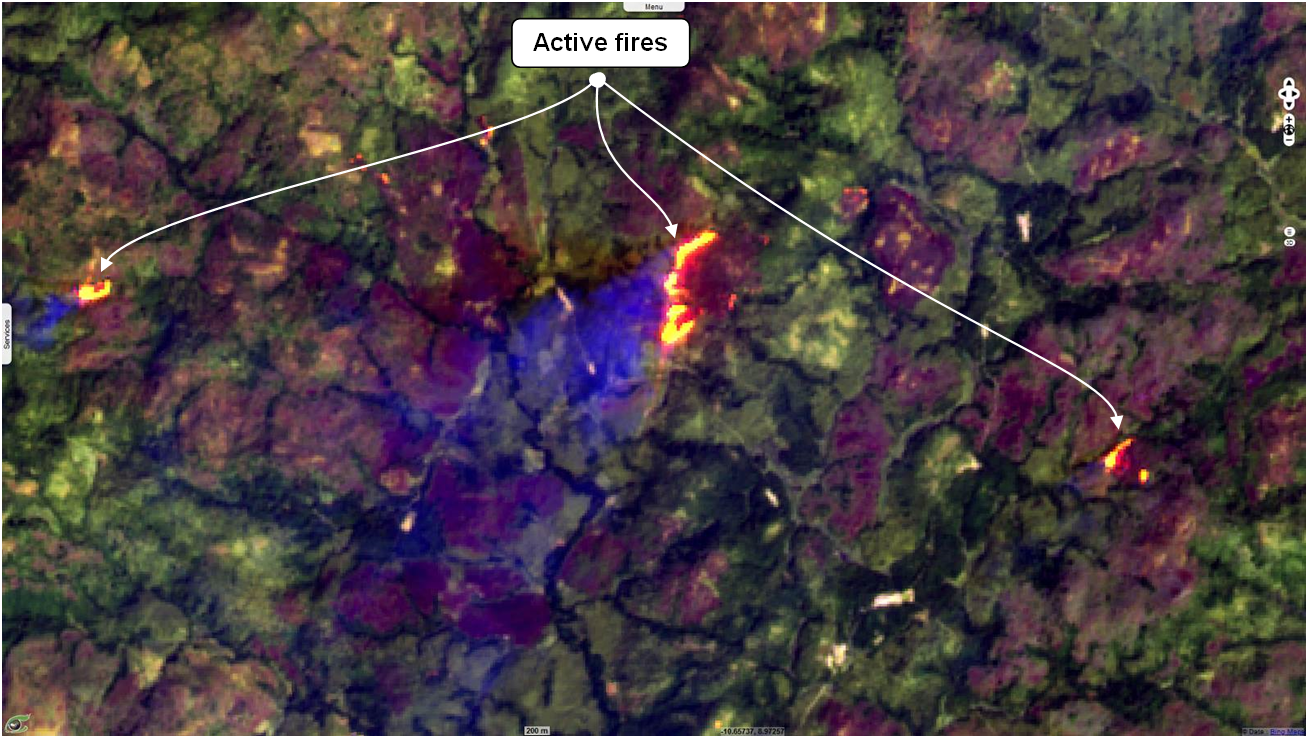
The figure shows a Sentinel-2 image in 12-11-2 colour composition acquired on January 14, 2020 in the dry season as evidenced by the daily precipitation graph below. Active fire fronts appear as orange-yellow colour.
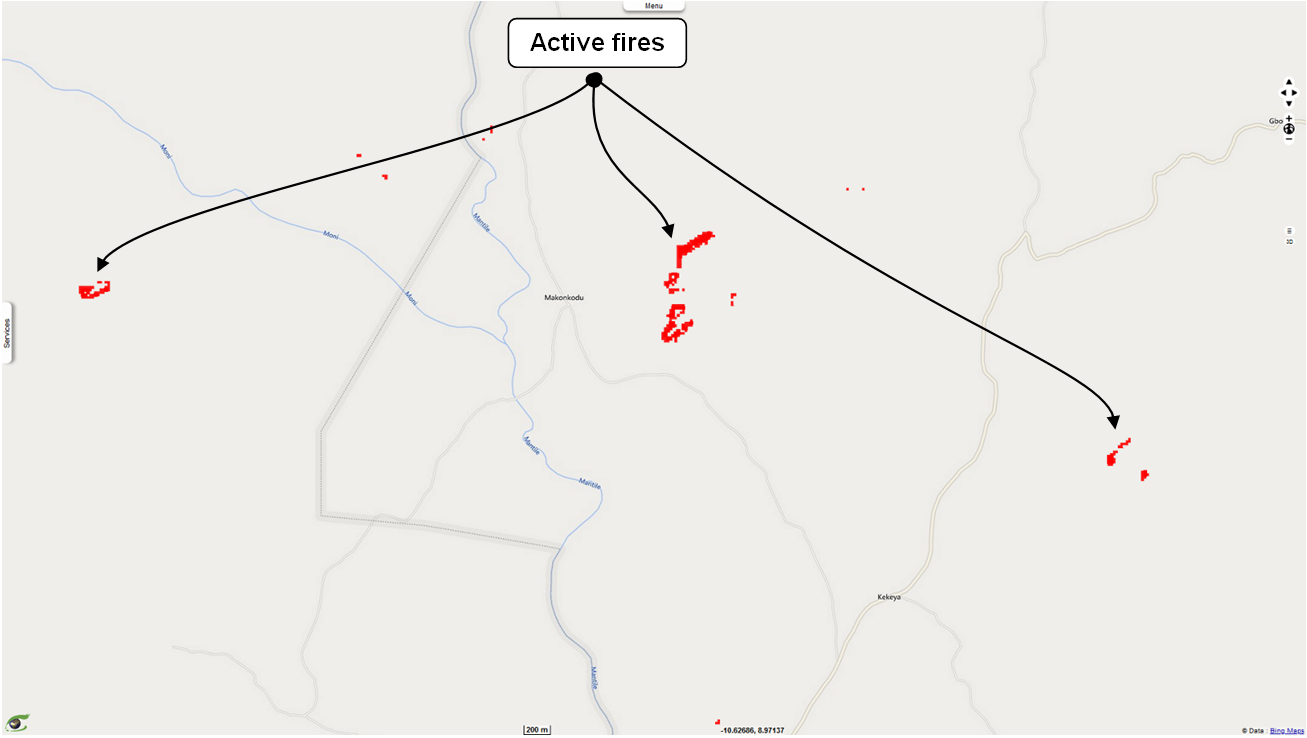
The Fig.29 shows in red the result of the segmentation of the active fire fronts observed on the image Fig.29
These active fires can be reported as an alert.