Land-use/Land-cover evolution in Mt Nimba priority landscape
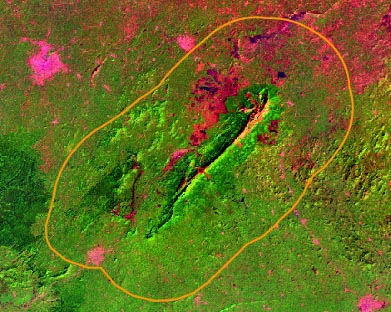
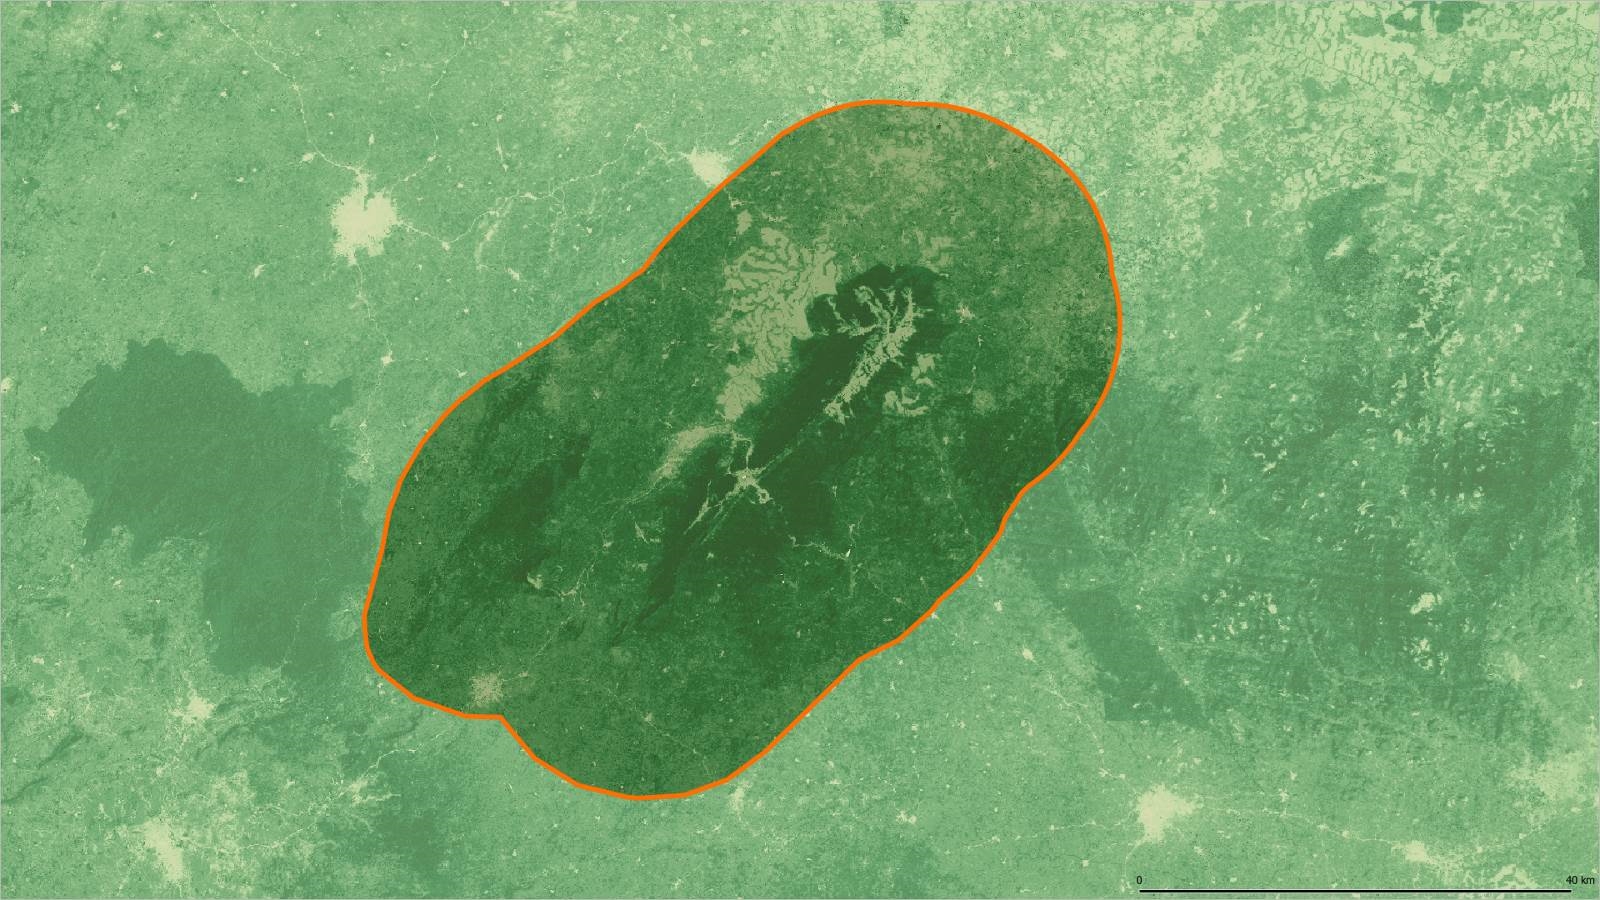
Shared between Guinea, Côte d’Ivoire and Liberia, the Mt Nimba Landscape displays an important variety of ecosystems, ranging from lowland Guinean forests to montane forests and Guinean savannas. With altitude ranging from 400 to 1750m, M t Nimba is a unique centre of endemism, holding many species of plants, invertebrates, amphibians and mammals not found anywhere else in the world. The Landscape has well-established Protected Areas and is a UNESCO World heritage Site in its northern section.
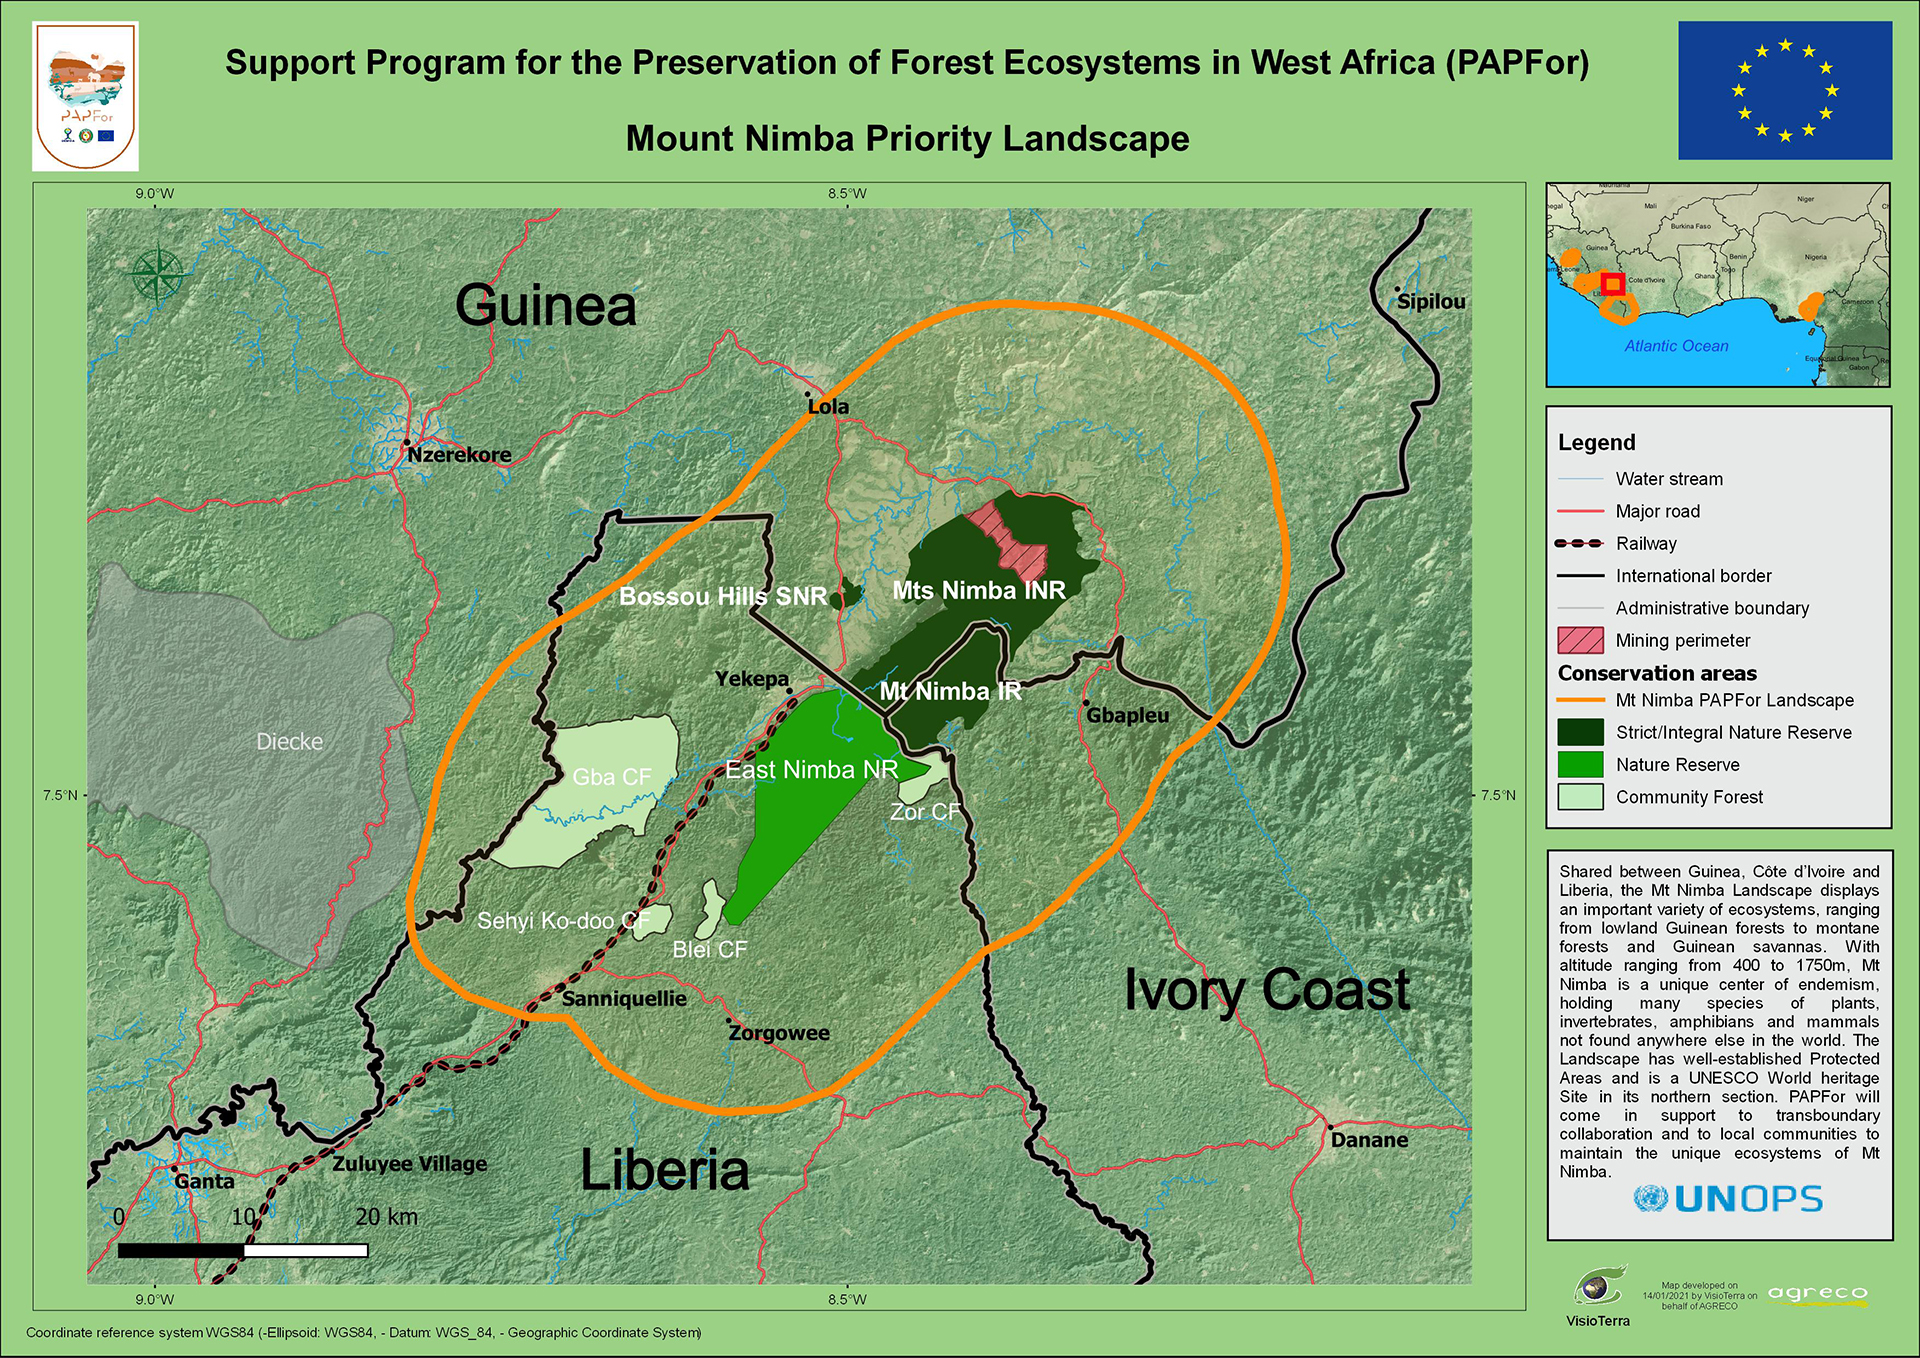
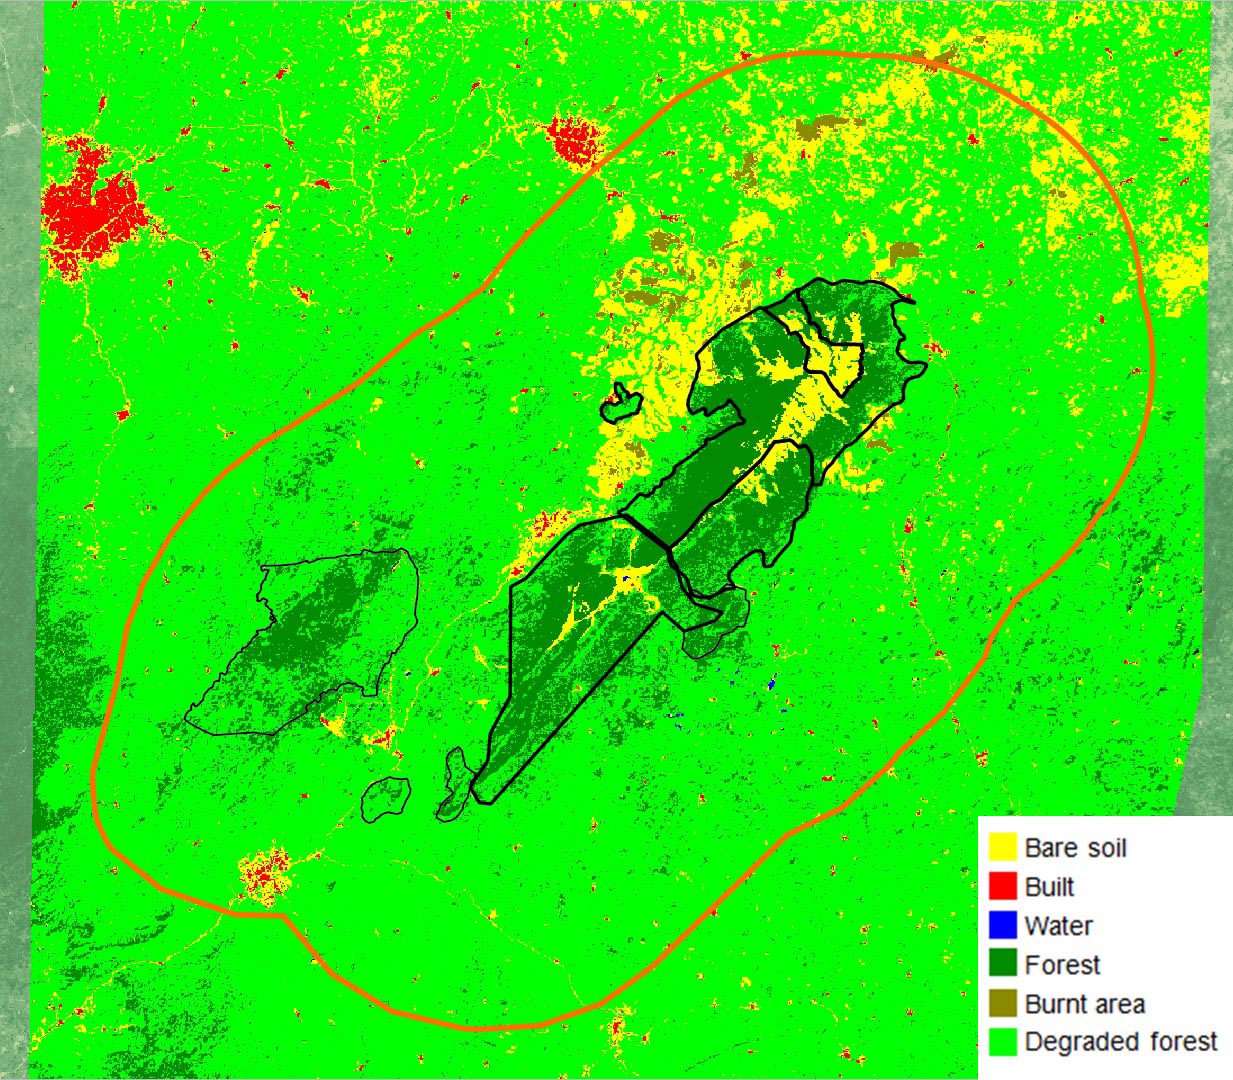
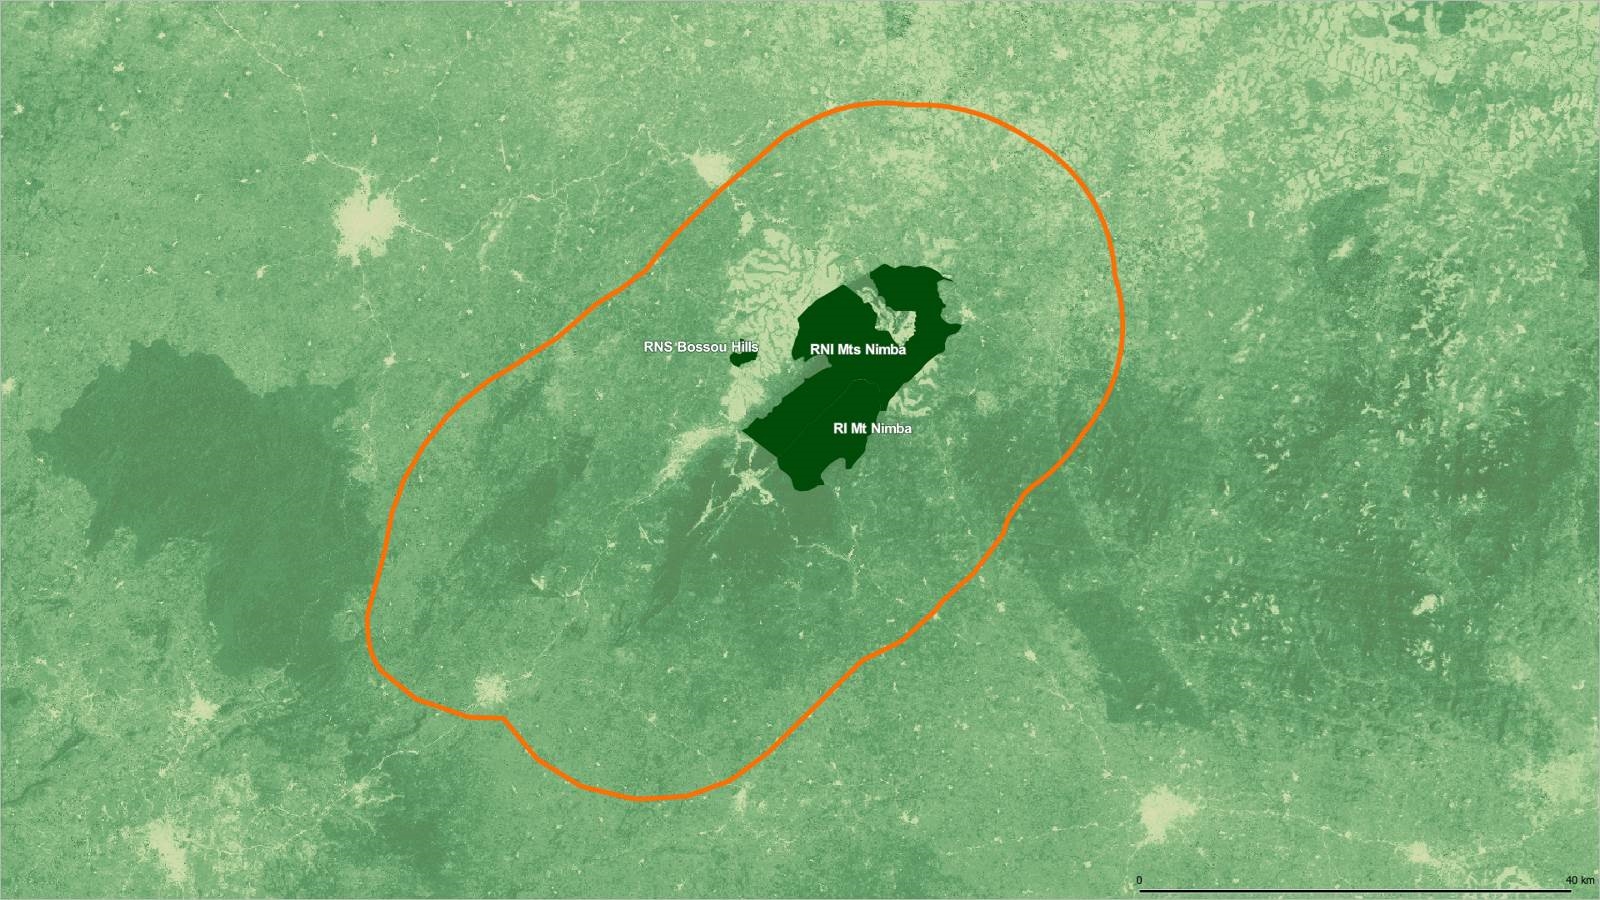
The landscape encompasses Mt Nimba Integral Reserve (IR), Mts Nimba Integral Nature Reserve (INR), Bossou Hills Strict Nature Reserve (SNR) and East Nimba Nature Reserve (NR). It also encompasses four community forests (CF): Blei, Gba, Sehyi and Zor.
This page shows the evolution of Land Use / Land Cover (LU/LC) in the Landscape between 2002 and 2020 using Landsat-5/7/8 optical satellite images. The study also concerns examples of deforestation, active fires and burnt areas detected by the Sentinel satellites of the European Copernicus program.
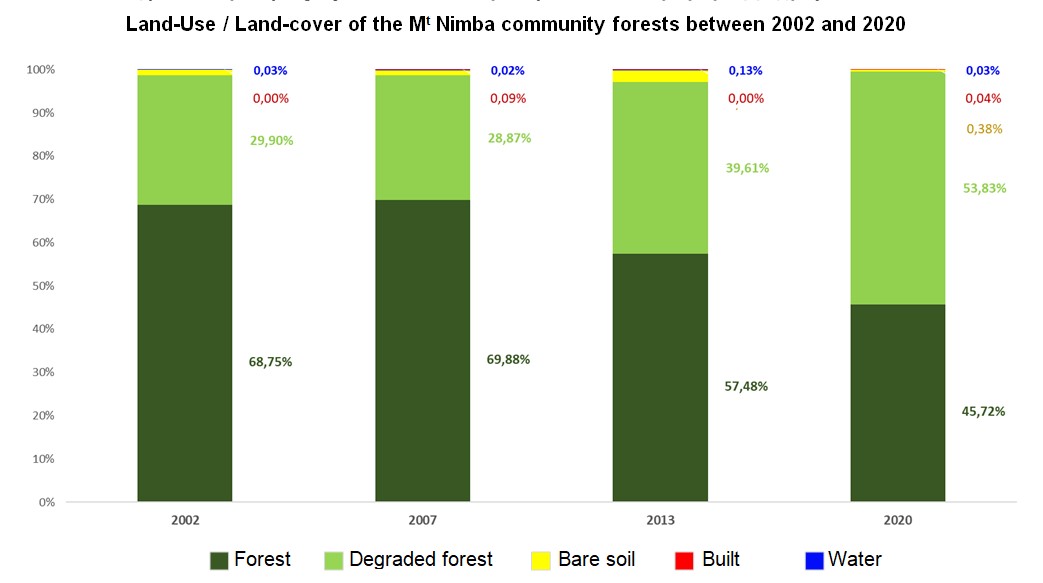
Land-use / Land-cover (LU/LC) of the Mt Nimba Prioritary Landscape between 2002 and 2020
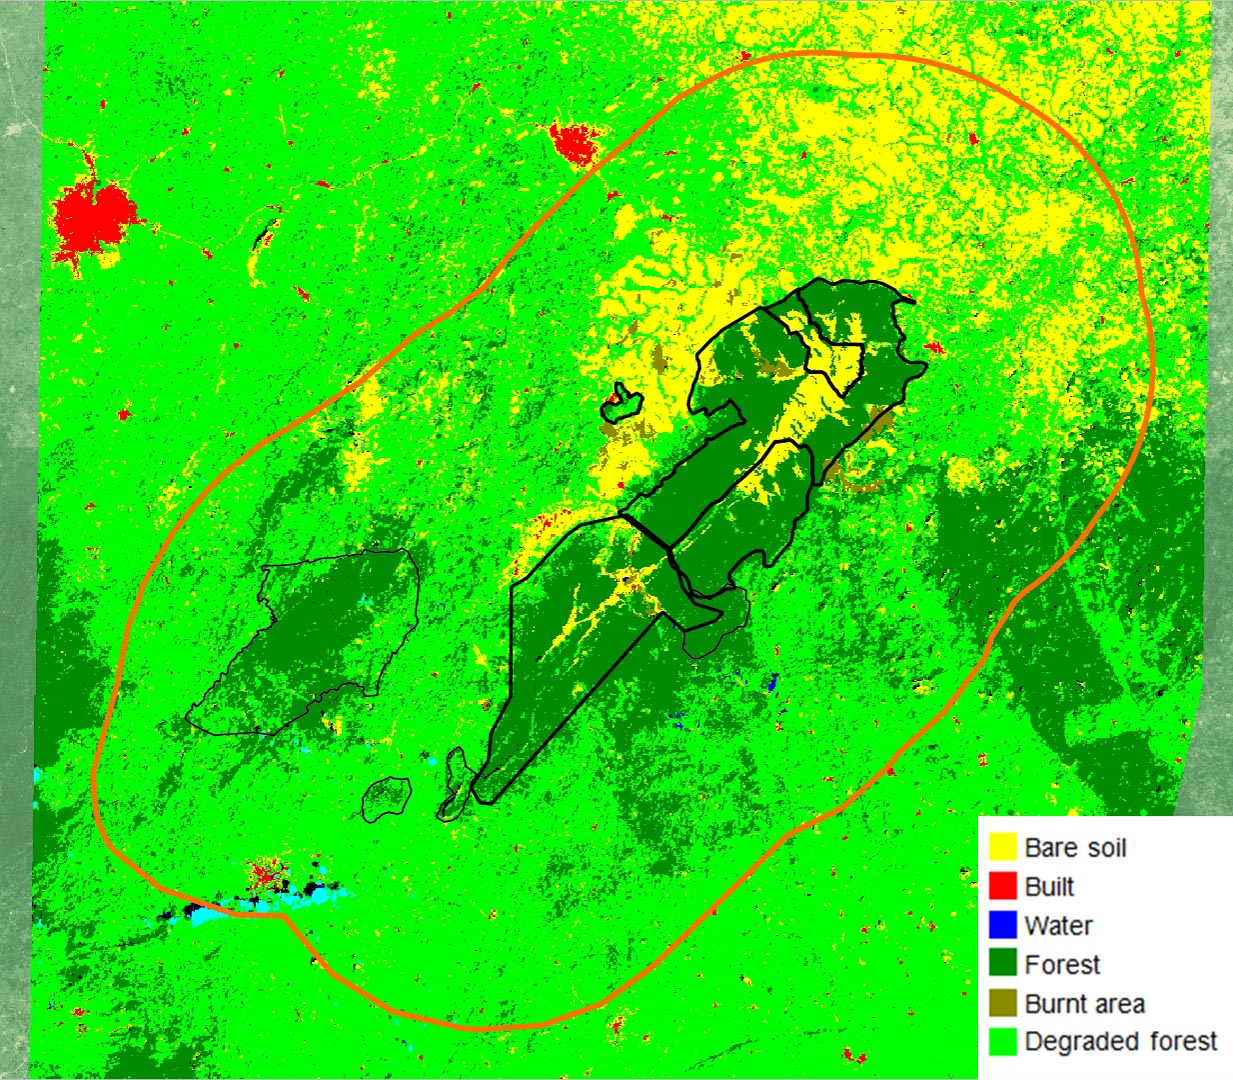
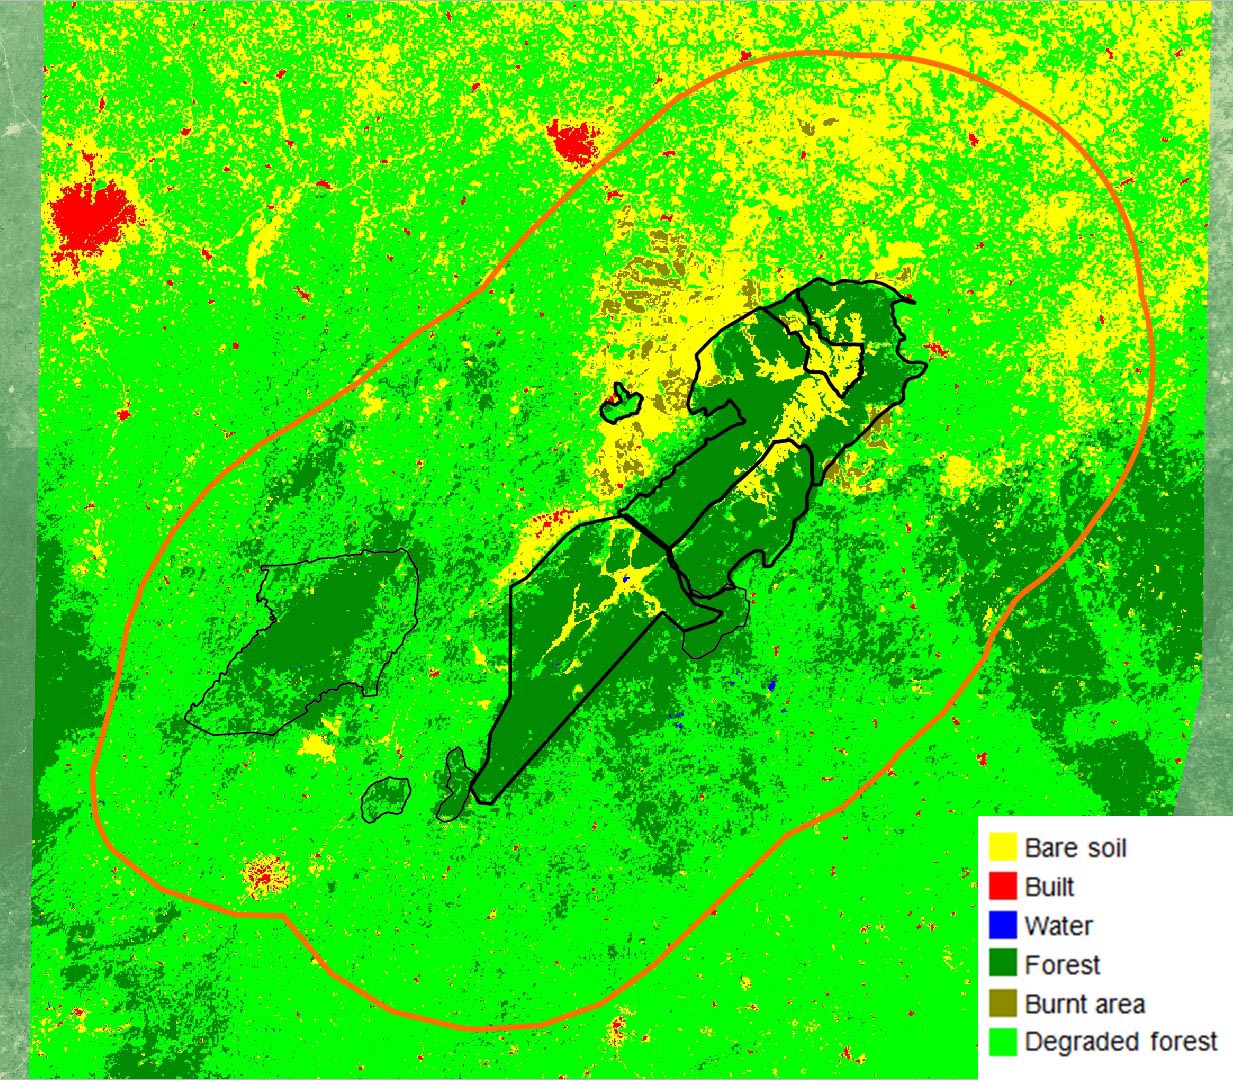
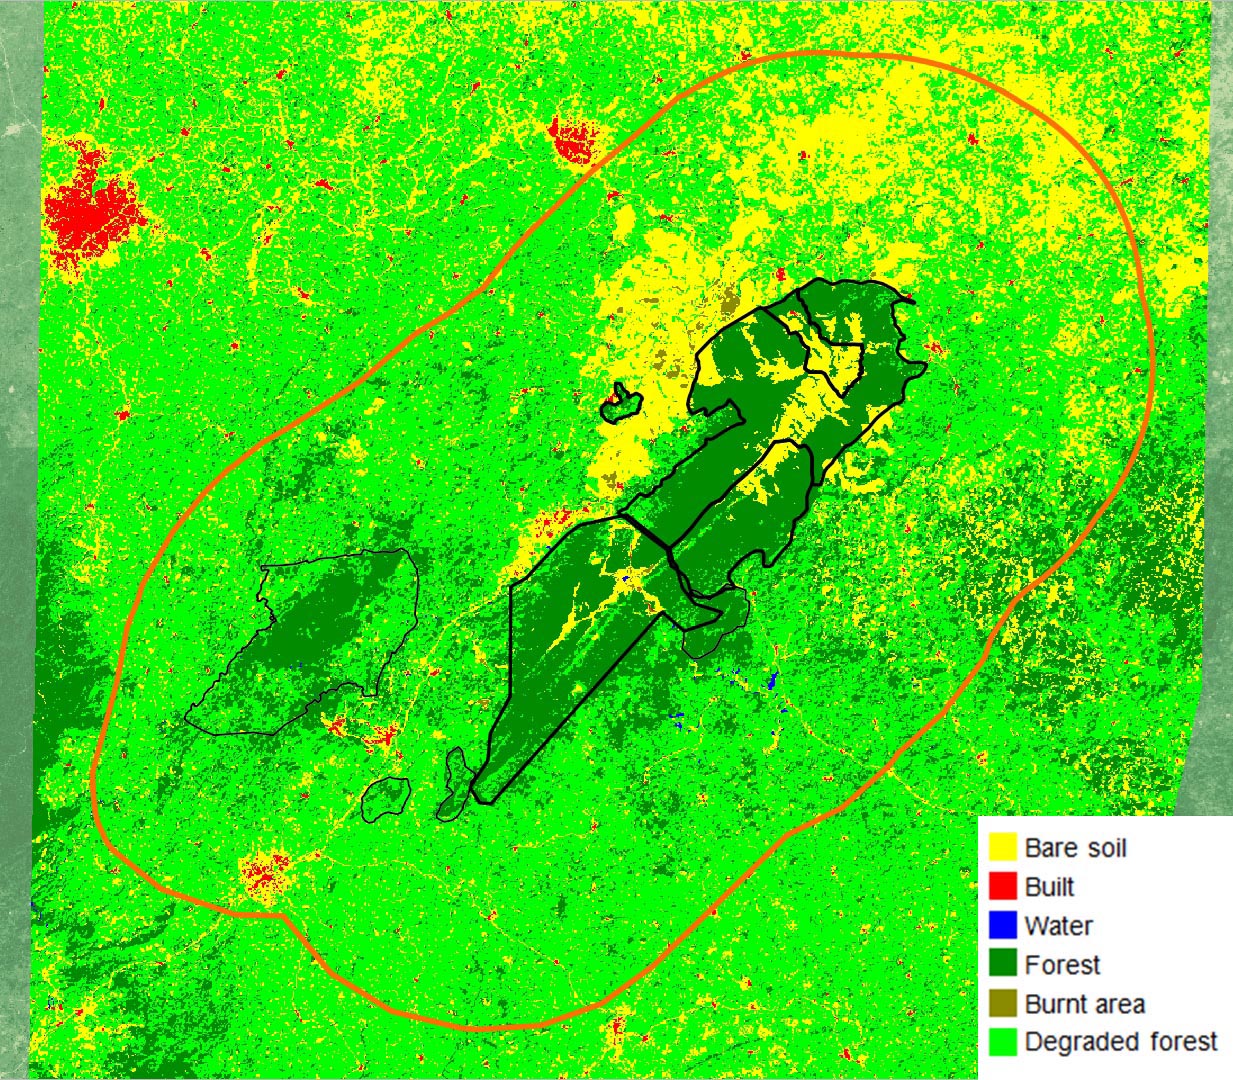
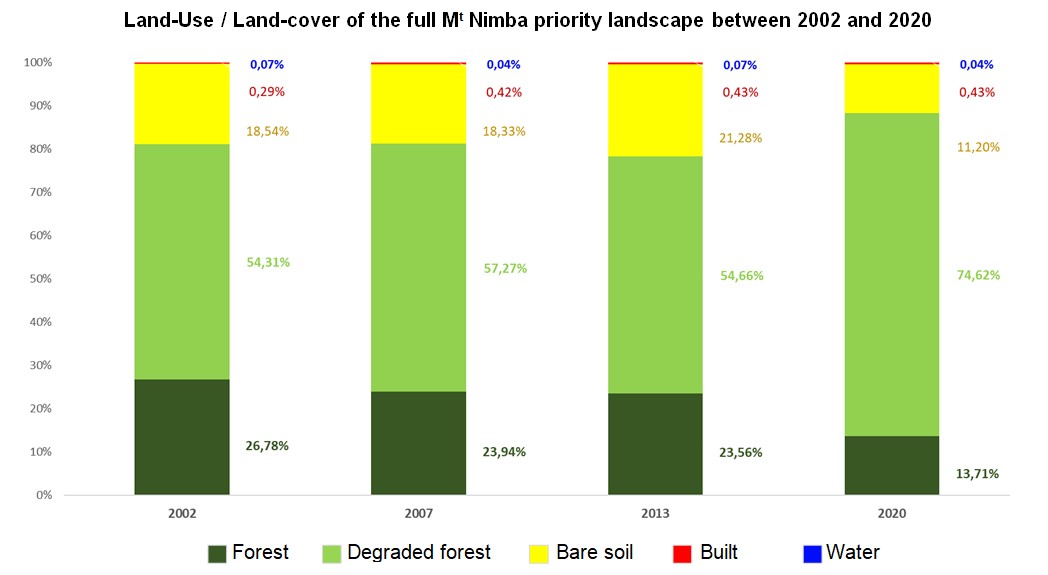
The following figure shows the evolution of the different land cover classes in the entire Mt Nimba priority landscape from 2002 to 2020.
It can be seen that the forest cover was relatively preserved between 2002 and 2013. In a second phase, there is a loss of forest cover of 9.85% during the period 2013 to 2020.
Urban expansion also follows a continuous growth according to statistics ranging from 0.29% (2002), 0.42% (2007), 0.43% (2013) to 0.43% (2020).
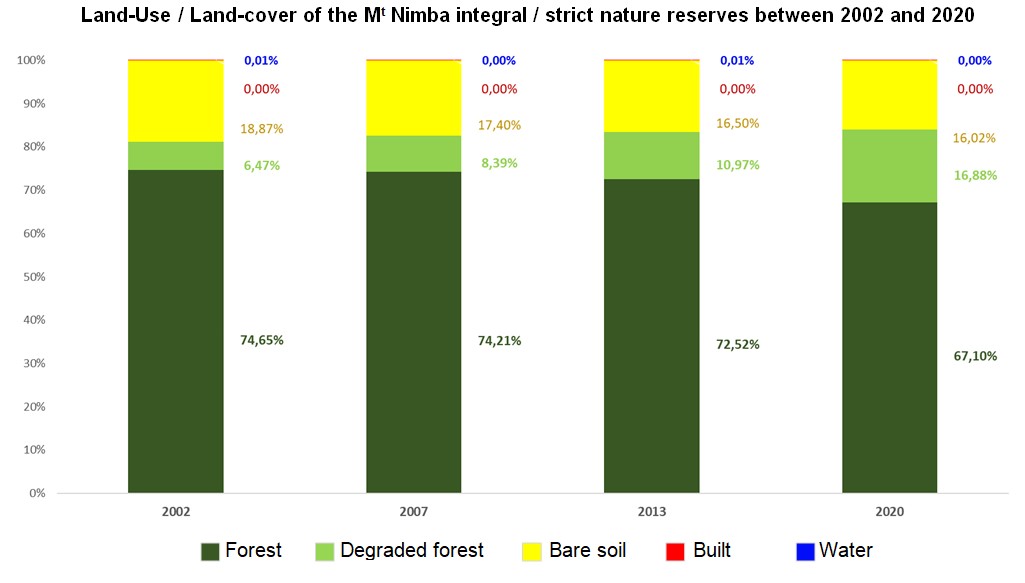
The following figure shows the evolution of the different classes of land cover in the strict and integral reserves of Mt Nimba (Fig.9) between 2002 and 2020.
These strict and integral reserves are largely occupied by forest (about 70%).
It can be seen that this forest cover was preserved between 2002 and 2013 with low losses (0.44% during the period 2002-2007 and 1.69% during the period 2007-2013). Conversely, a significant loss of 5.42% was observed during the last period from 2013 to 2020.
There is a total absence of anthropogenic infrastructure in these reserves (0%).
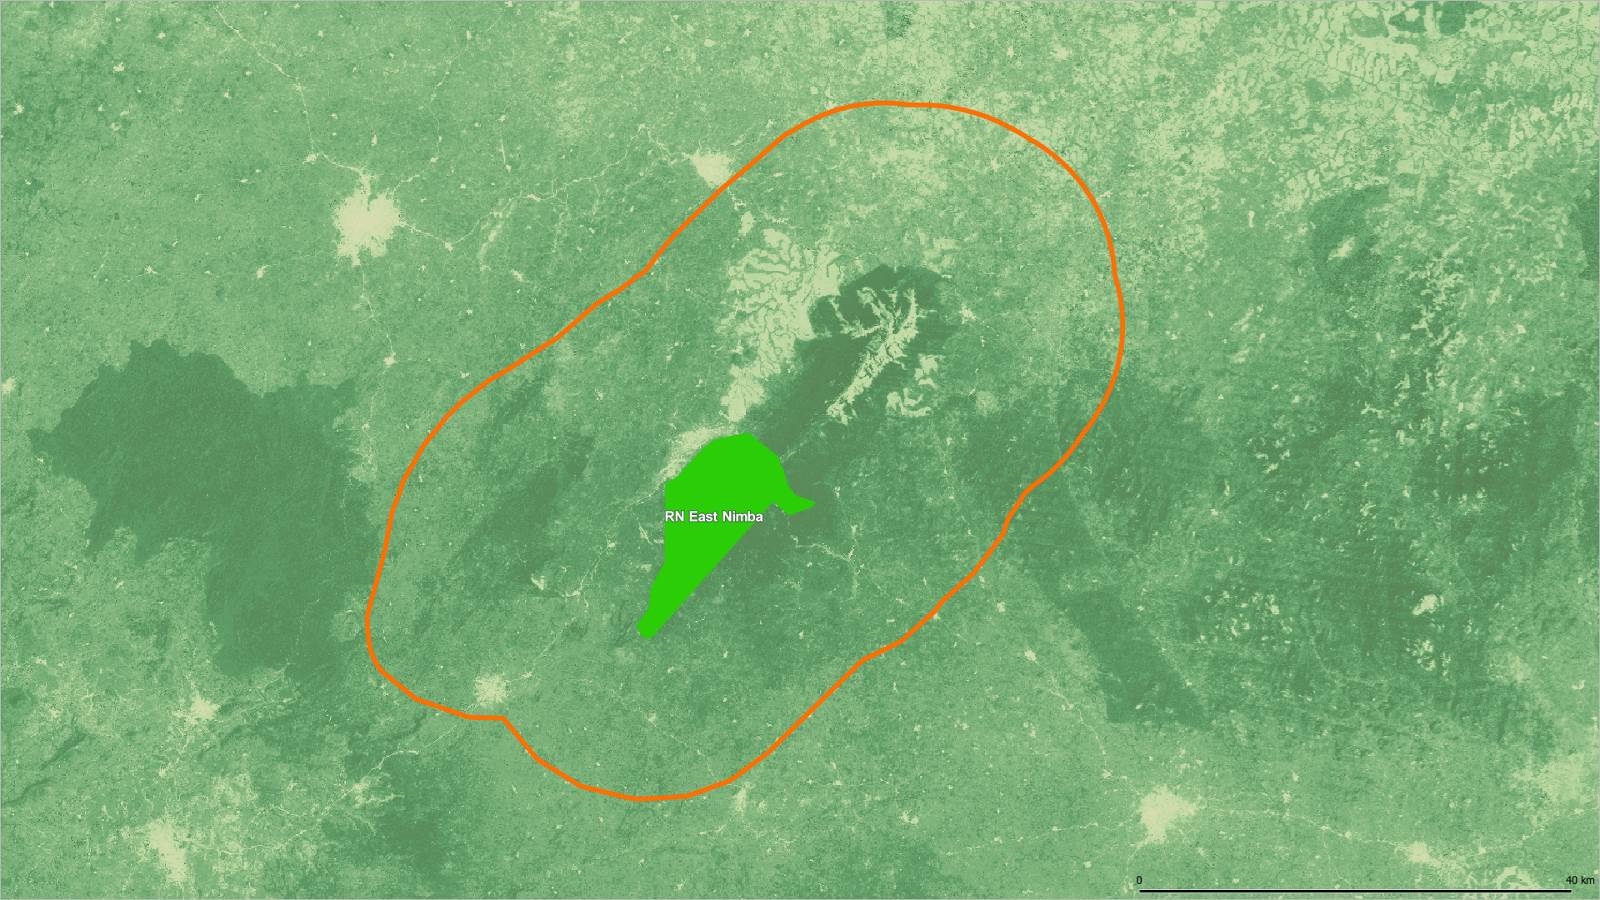
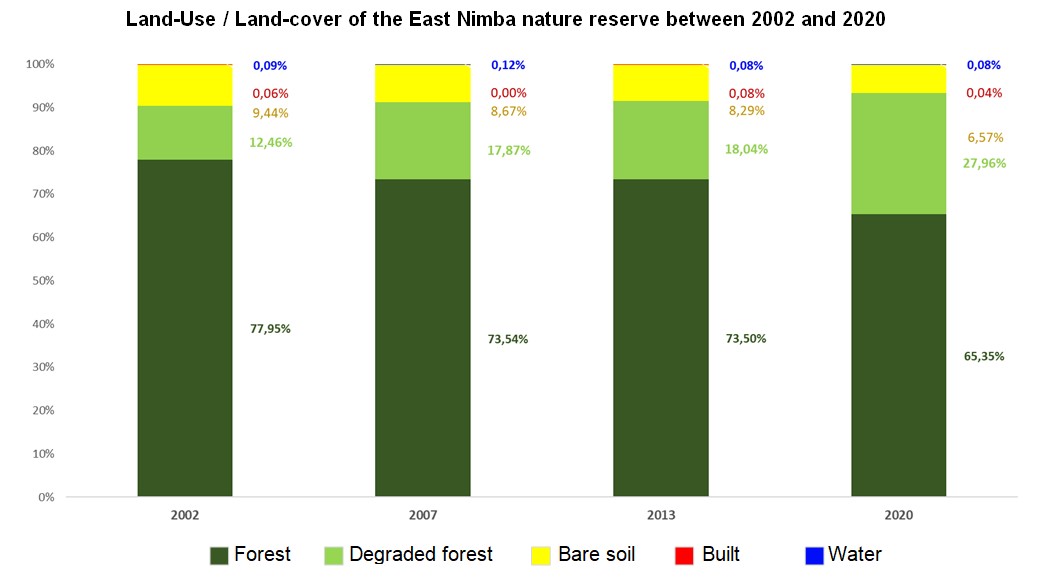
The following figure shows the evolution of the different land cover classes in the East Nimba Nature Reserve of the Mt Nimba Priority Landscape (Fig.11) between 2002 and 2020.
This nature reserve is also essentially occupied by forest (about 80%).
It can be seen that the forest cover suffered a progressive degradation between 2002 and 2013 with an acceleration between 2013 and 2020. Indeed, the losses of the forest cover amounted to 4.41% from 2002 to 2007, 8.15% from 2013 to 2020.
These losses are more pronounced than those observed in strict and integral reserves .
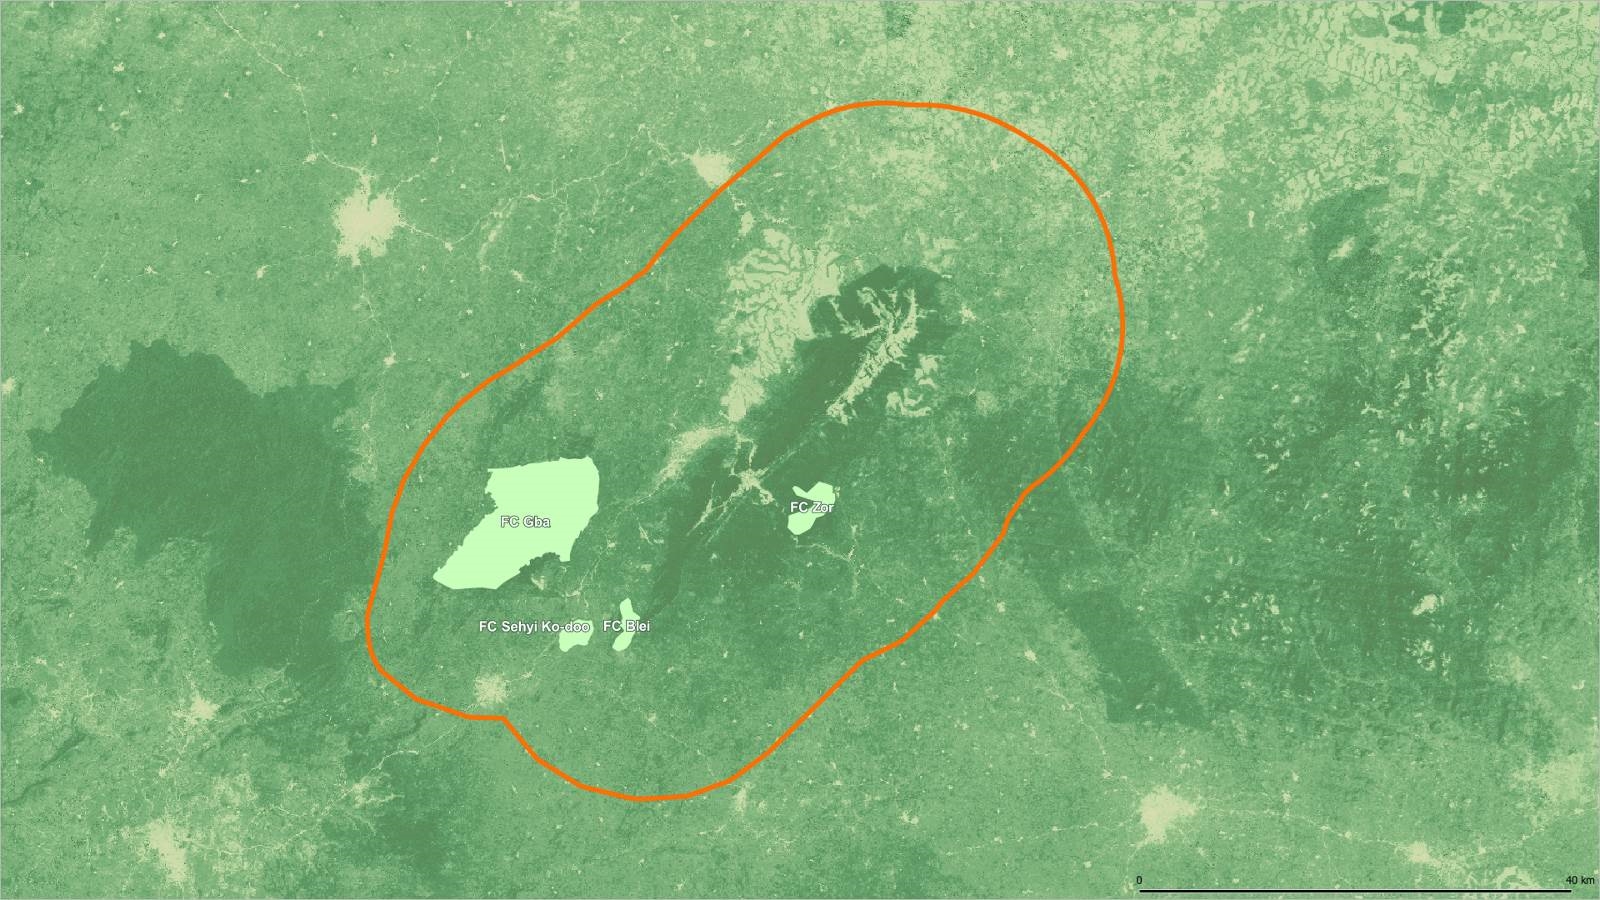
The following figure shows the evolution of the different classes of land cover in the community forests of the priority landscape of Mt Nimba (Fig.13) between 2002 and 2020.
Compared to strict and integral reserves and natural reserve, community forests offer less forest cover at about 60%.
It can be seen that this forest cover was preserved between 2002 and 2007. There are nevertheless very significant losses of: 12.40% during the period from 2007 to 2013 and 11.76% during the period from 2013 to 2020.
The short-lived slight increase in forest cover between 2002 and 2007 can be explained by the effect of seasonality and cloud cover. Indeed, for the year 2007, several Landsat-7 images acquired during different seasons were mosaicked to circumvent the problems of cloud cover.
Loss of forest cover in the different conservation units of Mt Nimba between 2002 and 2020
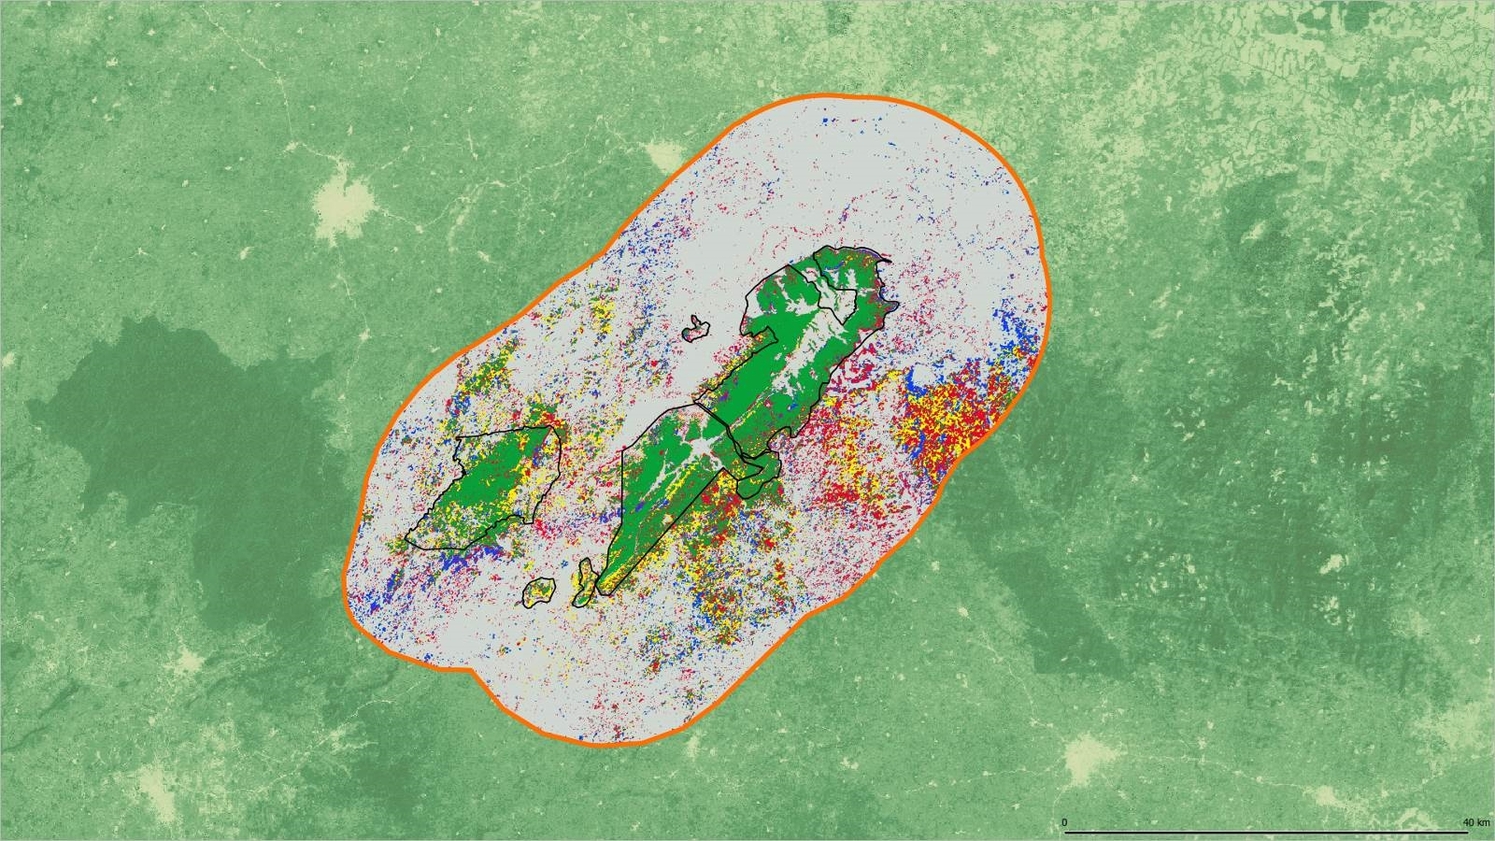
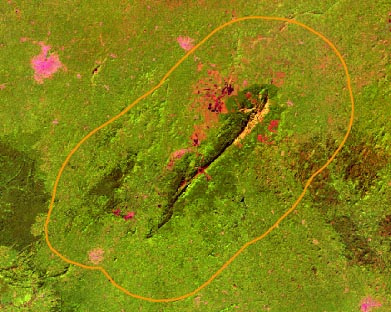
The following figure summarizes deforestation by period across the entire Mt Nimba priority landscape. The areas in grey represent the areas deforested before 2002, the areas in blue are those deforested between 2002 and 2007, the areas in yellow are those deforested between 2007 and 2013 and the areas in red are those deforested between 2013 and 2020. This dominant red testifies to the acceleration of deforestation in the last period.
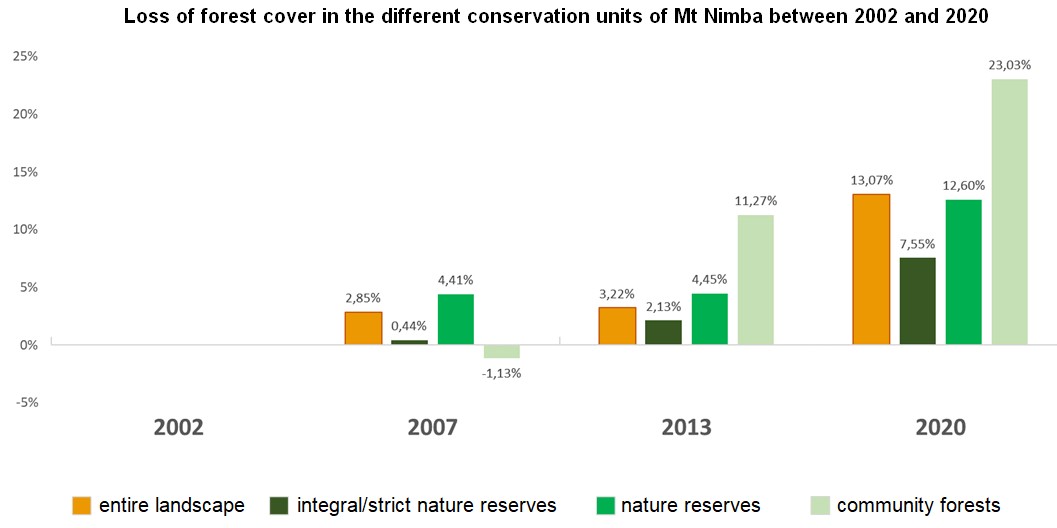
The figure shows the evolution of forest cover loss by period in the four conservation units: entire landscape, strict / strict nature reserves, nature reserves and community forests.
It can be seen that the integral / strict nature reserves have been preserved, while the nature reserve and the community forests have suffered a greater loss of their vegetation cover, particularly during the last period.
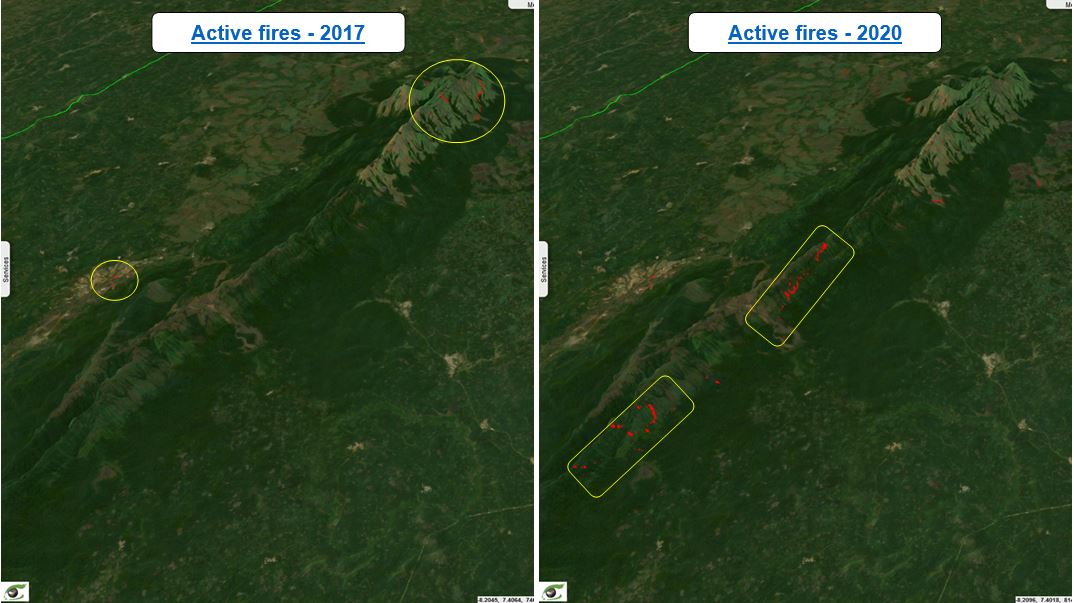
Fire detection
A novel algorithm automatically detects active fire fronts from Sentinel-2 optical data.
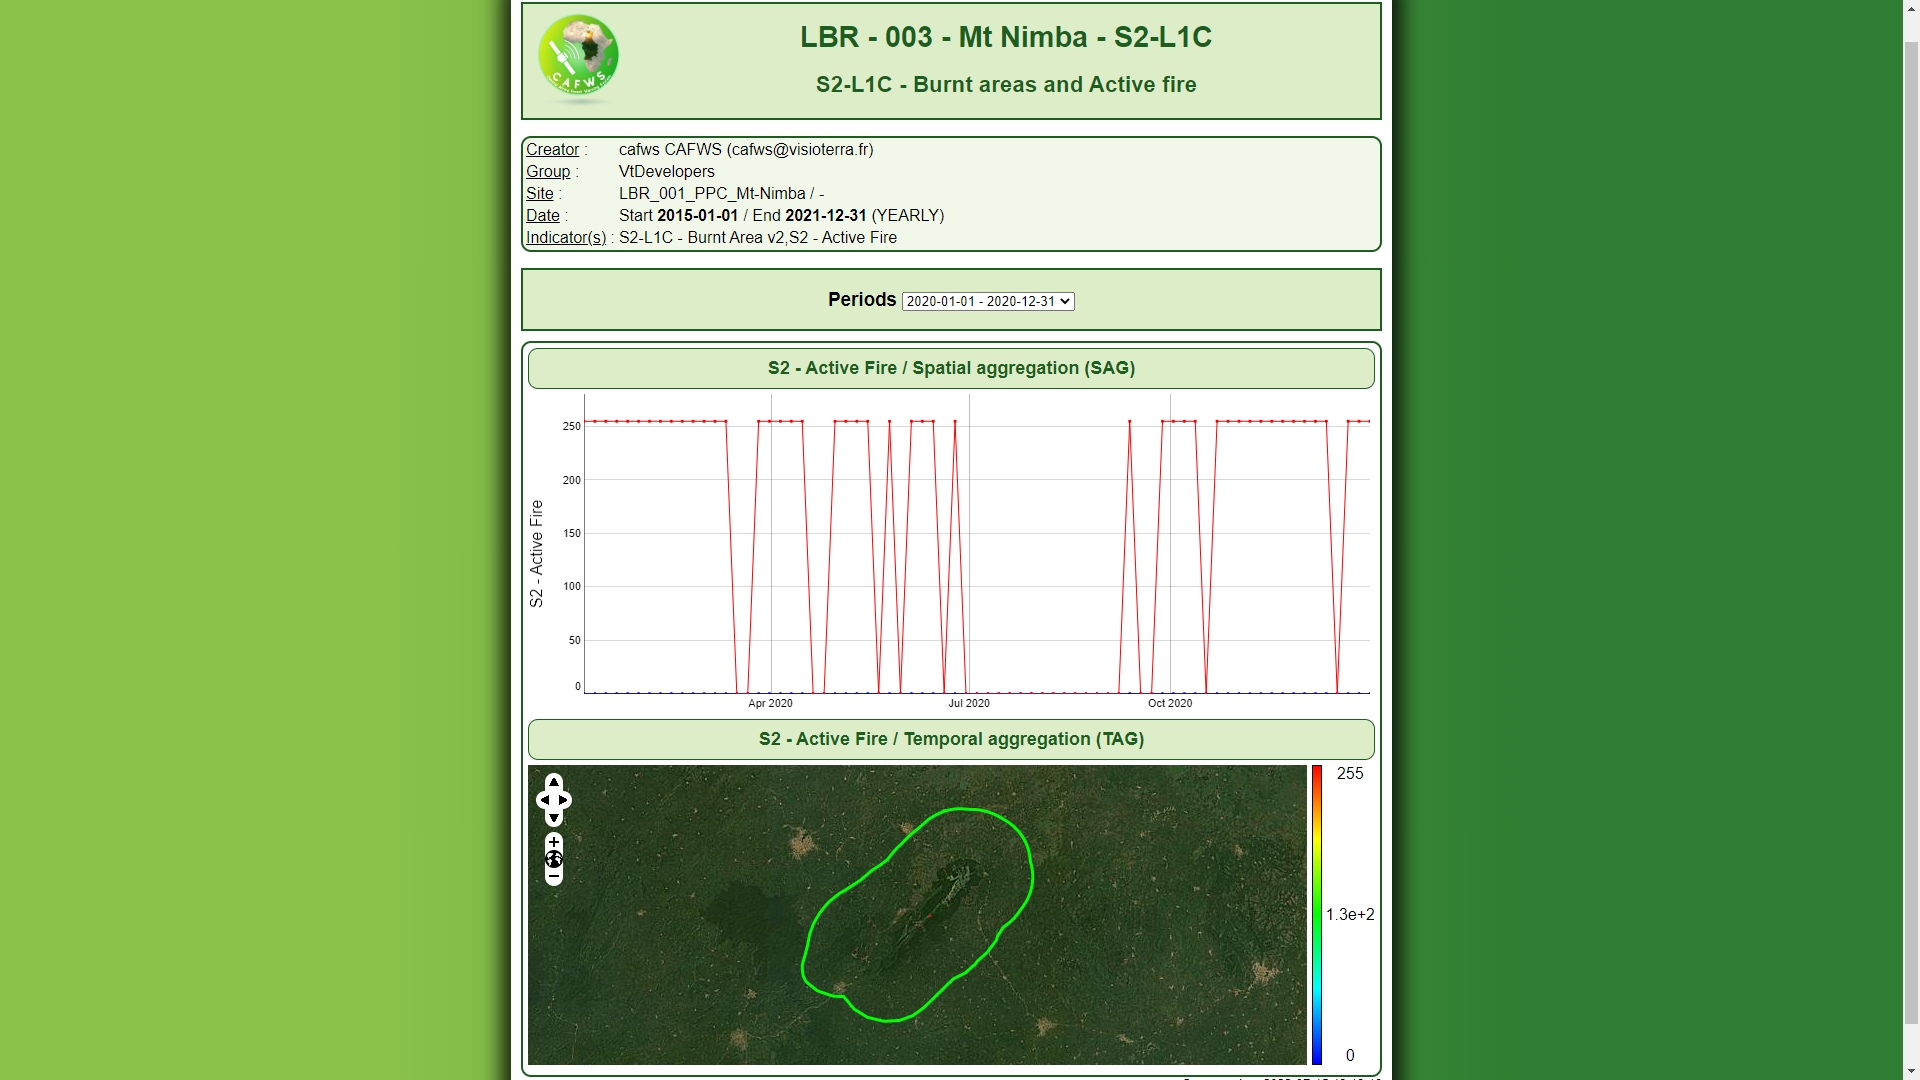
Burnt areas - Periodic bulletin
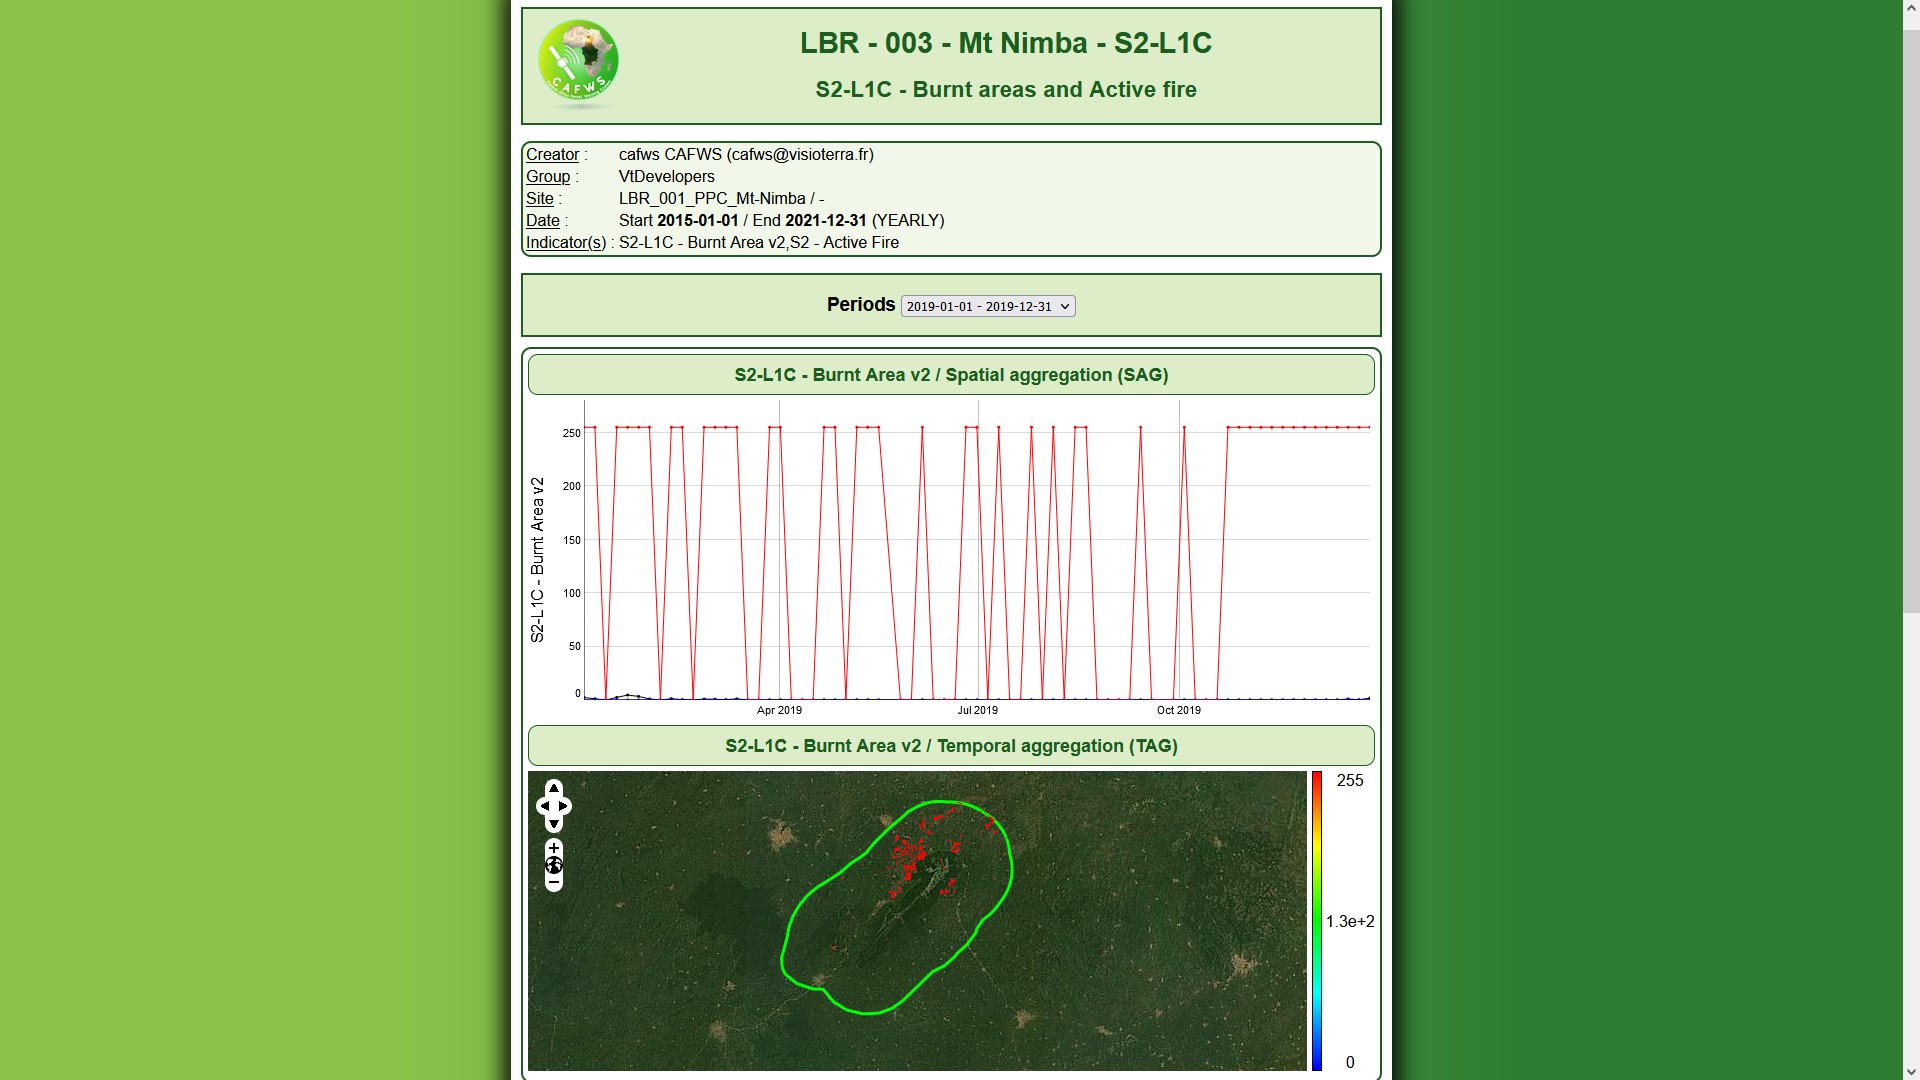
shows the periodic bulletin generated by a geoservice monitoring burnt areas and active fires in the priority landscape of Mt Nimba between 2015 and 2021. This periodic bulletin was produced by the CAFWS platform developed by VisioTerra. The first and second sections of the periodic bulletin provide information on the name of the geoservice, the site, the indicator(s) to be calculated (active fires, burnt areas, etc.) and the period of time during which the geoservice will operate. The third section allows the user to choose the period for which the results are to be displayed (the period here is annual). The fourth section concerns the results of the spatial aggregation of burnt areas. The red curve shows the presence (value 255 on the y-axis) or absence (value 0 on the y-axis) of burnt area in the study area during the defined period. The fifth section shows the results of the temporal aggregation of burnt areas. Zones where a burnt area was detected at least once during the study period are rendered in red. Here, for example (Fig.21), the burnt areas are those detected in 2019.
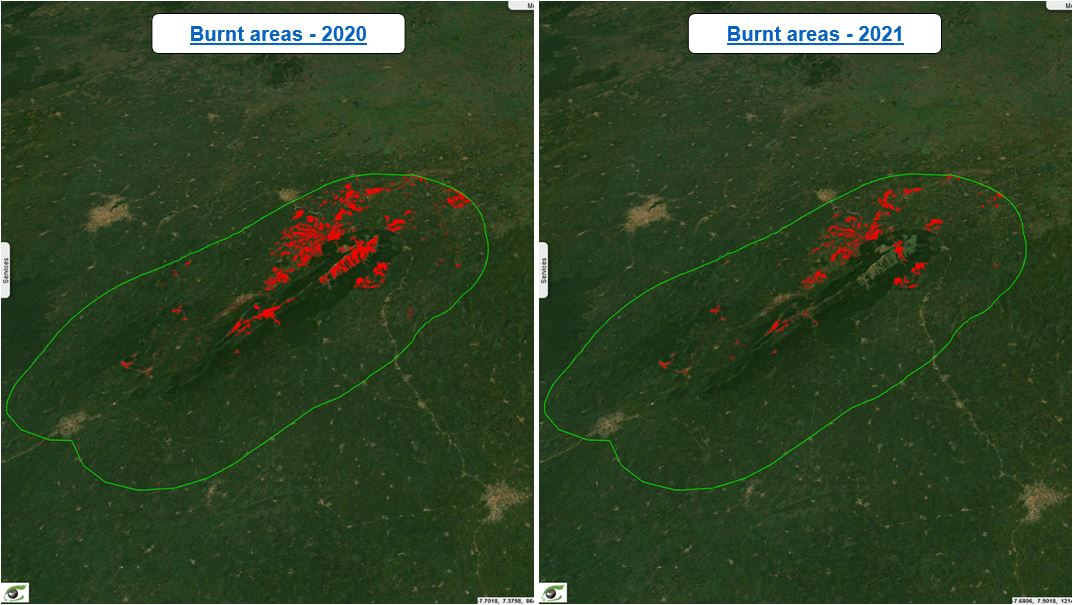
Burnt areas
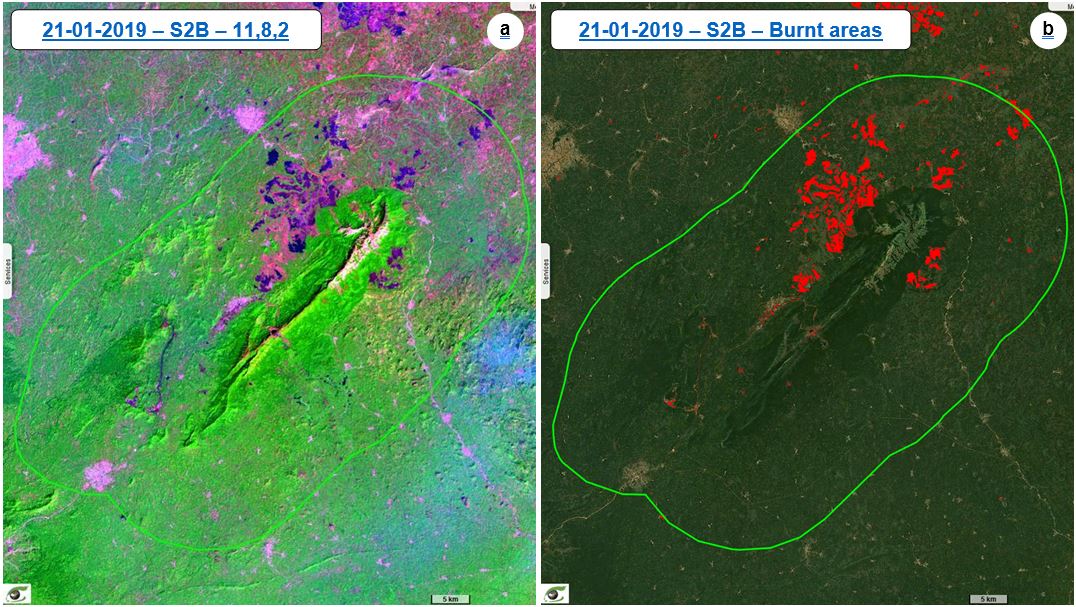
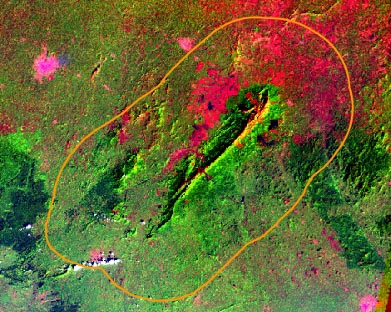
The Fig.23 shows a Sentinel-2 image that exploits the richness of the spectral bands of its multispectral instrument MSI. Here, bands 11, 8 and 2 correspond to shortwave-infrared, near-infrared and blue respectively. These three bands 11, 8, 2 have been assigned to the red, green and blue planes.
The Sentinel-2 tile (Fig.23a) was acquired in the dry season on January 21, 2019. Burnt areas are detected automatically and are rendered in red (fig.23b).
The burnt area indicator is calculated from Sentinel-2 optical data using an algorithm derived from a classification analysis making use of “Machine Learning” methods.
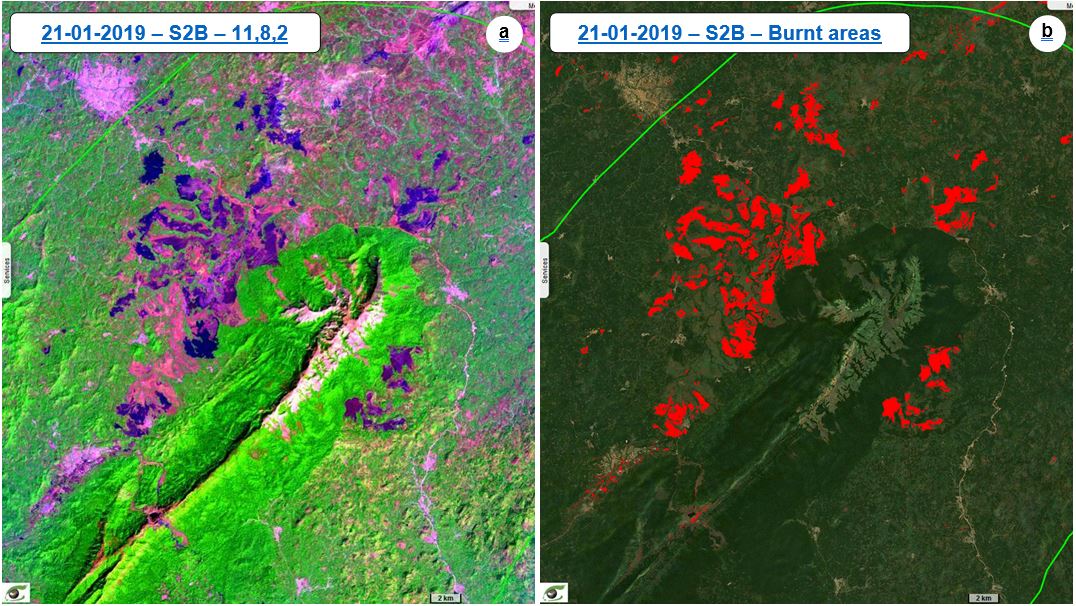
The Fig.24 shows a closer view of Fig.23 to the northwest of the landscape where there are extensive burnt areas.
Active fires - Periodic bulletin
The figure shows the periodic bulletin generated by the same geoservice monitoring burnt areas and active fires in the priority landscape of Mt Nimba between. Monitoring is performed from 2015 to 2021 with the indicator of active fires. The red areas in the temporal aggregation section image represent areas where an active fire front was observed at least once during the study period.
Active fires
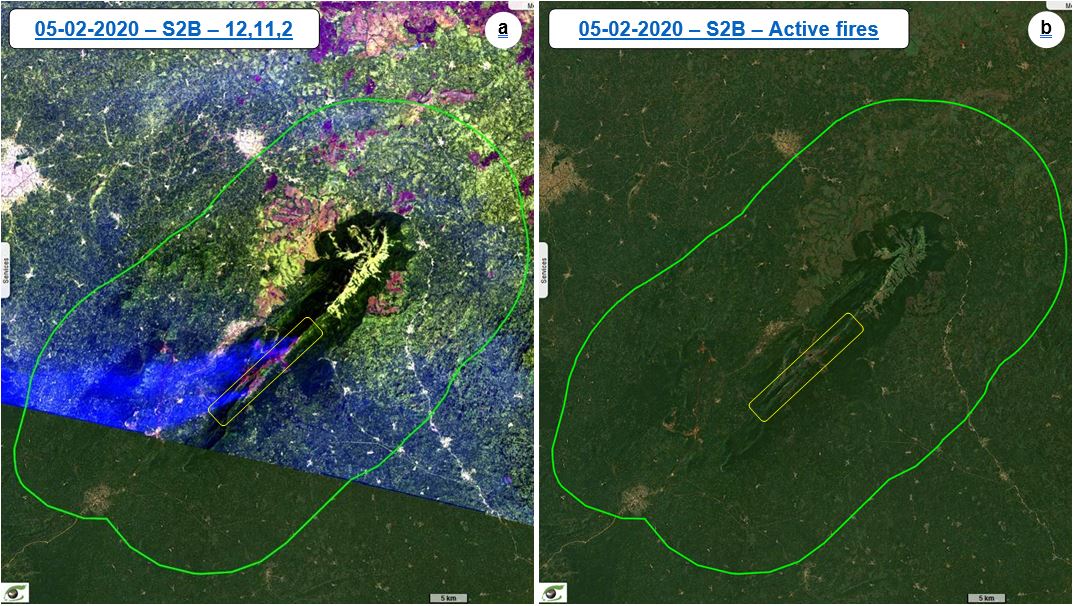
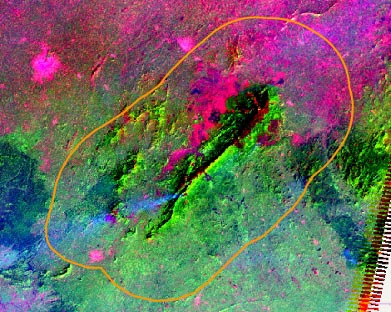
The figure shows a Sentinel-2 image in 12-11-2 colour composition acquired on February 05, 2020 (fig.27a) and the result of active fires automatically detected for the same date, rendered in red (fig.27b).
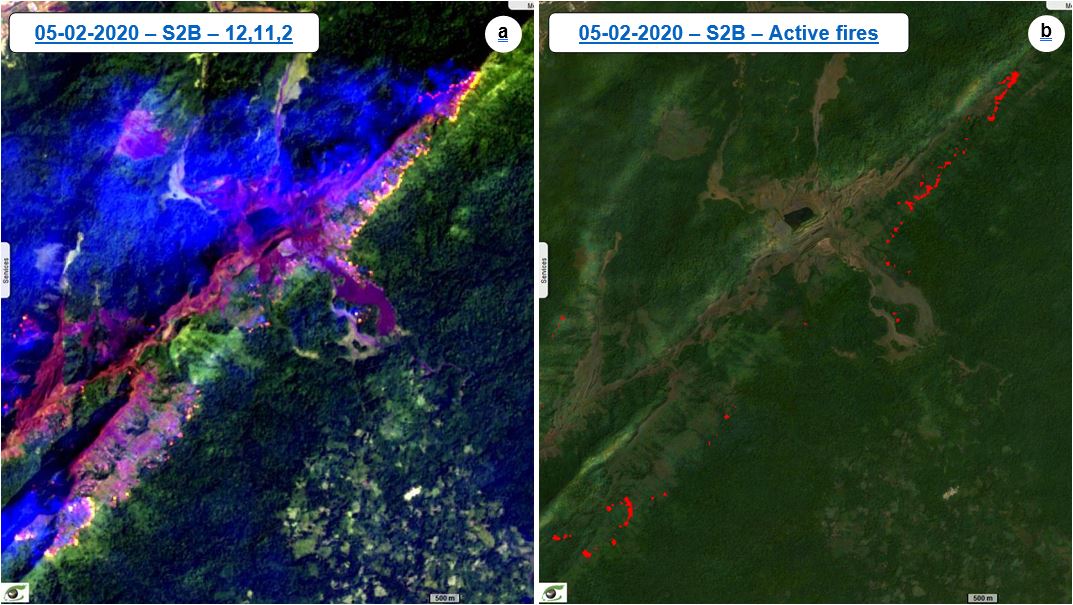
The Fig.28 shows a zoomed view of fig.27 which highlights active fire fronts.