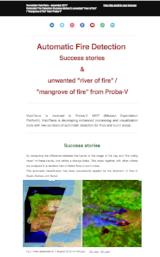
VisioTerra has developed a fully automated change detection service enabling users to see the history of changes detected in specified monitored areas. See video in English or French.
A first release of this service is applied to “Fire” and “Burnt area” thematics” using the Proba-V 1-day synthesis 100 m ground sampling distance top of canopy (TOC) reflectances. This service is hosted in VisioTerra infrastructure VtWeb but has also been installed in VITO infrastructure in Belgium. The system is presently running continuously and processes the latest scenes in few minutes from their availability.
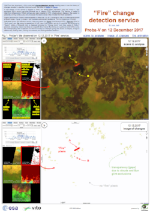
“Fire”
change detection service
Proba-V on 12 December 2017
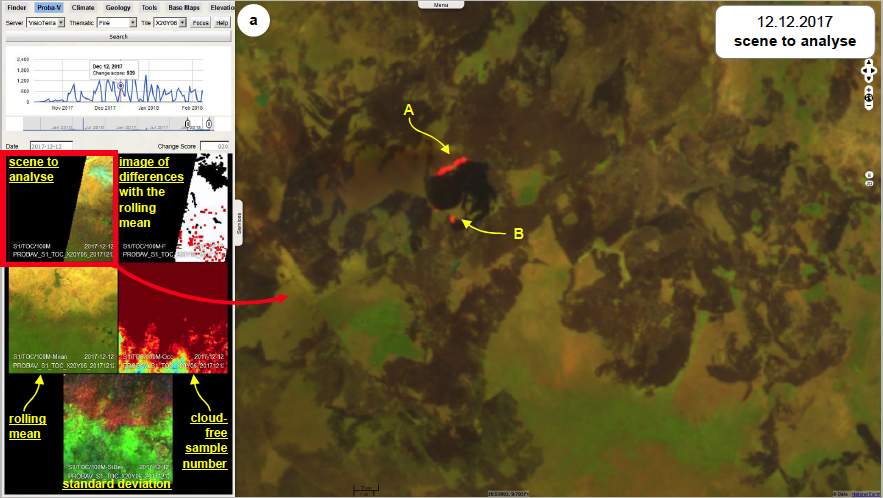
Figure 1a shows the Proba-V scene acquired on December 12, 2017 focusing on one of the fire events located in South Sudan. Left panel shows this VtProbaV service. User may select the -Server (VisioTerra or VITO), -Thematic (“Fire” or “Burnt area”) and -Tile being the predefined 10°x10° tiles of the Proba-V grid for S1 products. By activating the “Search” button, a temporal chart is displayed showing the “Change score” over three years of Proba-V products processing. Users may focus on a specific time interval. By clicking on a particular point of the curve, the corresponding date is selected and five thumbnails are displayed giving the -Scene to analyse, -Image of differences, -Rolling mean, -Rolling occurrences, and -Rolling standard deviation.
“Fire index” or “Burnt area index” are computed by comparing the S1 TOC product with a slicing mean of the 60 previous acquisitions.
This comparison enables to compute the:
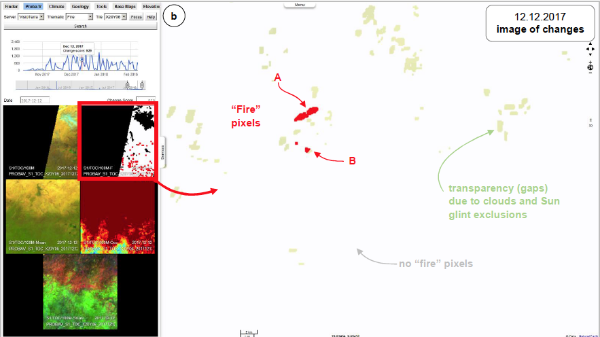
“Change score” - that matches with the number of “fire pixels” of the number of “burnt pixels” according to the chosen “thematic”,
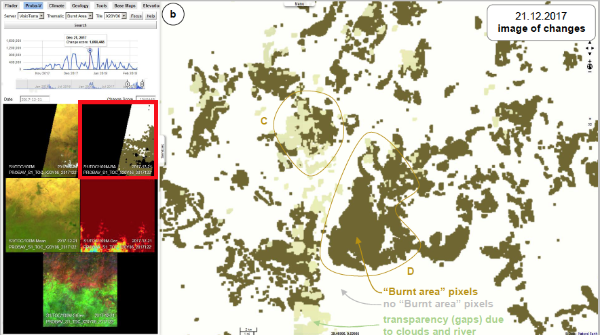
“Image of changes” - showing not only “fire” or “burnt” pixels but also the “transparent pixels”, i.e. the pixels that are covered by clouds or that have been eliminated to reduce false alarms (case of “Sun glints” for fire detection or riversides for the burnt area detection).
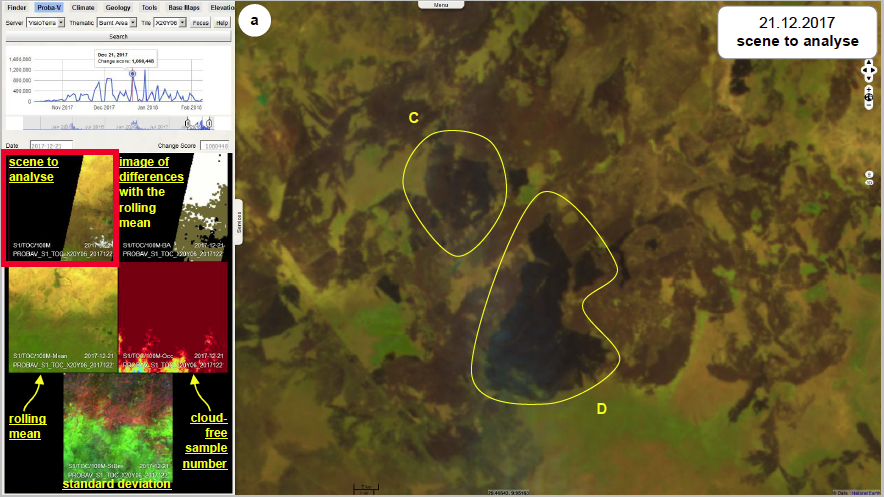
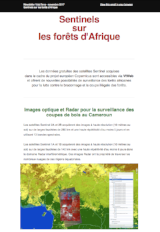
In fig.2, burnt area C is certainly due to the fires A and B of fig.1 while burn areas D have been produced by fires posterior to the 12 December 2017.
Les opinions exprimées dans ce document reflètent uniquement les résultats des travaux et l'opinion de VisioTerra.
The views expressed herein reflect solely the results of the works and the opinion of VisioTerra.