Copy
Newsletter VisioTerra : June 2017
Great Green Wall - Climate Change
View this email in your browser


Great Green Wall

Climate Change

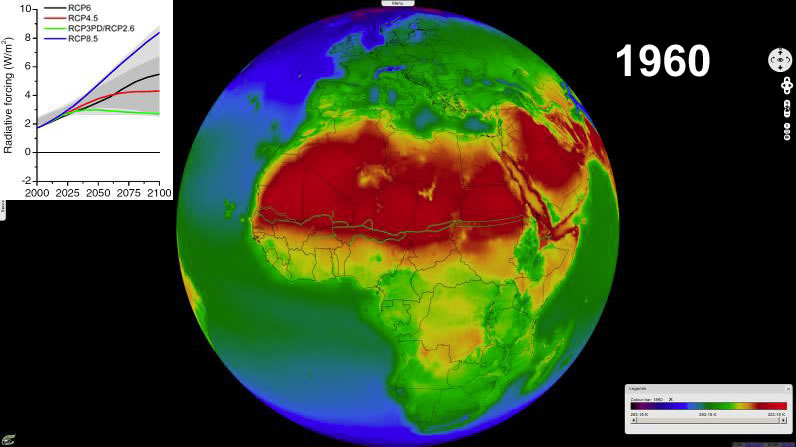
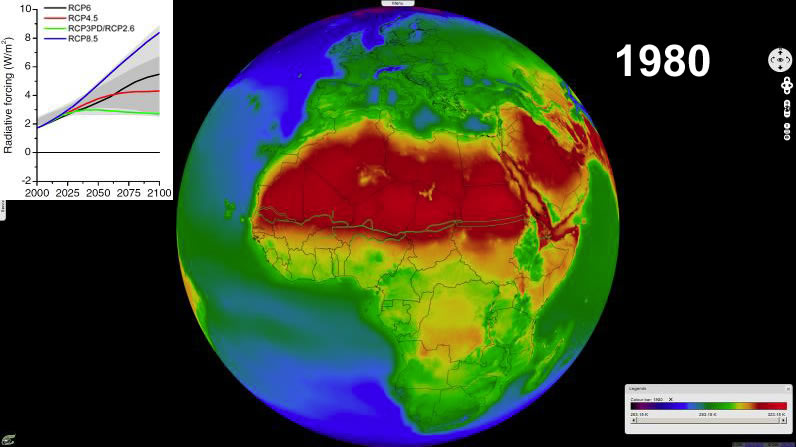
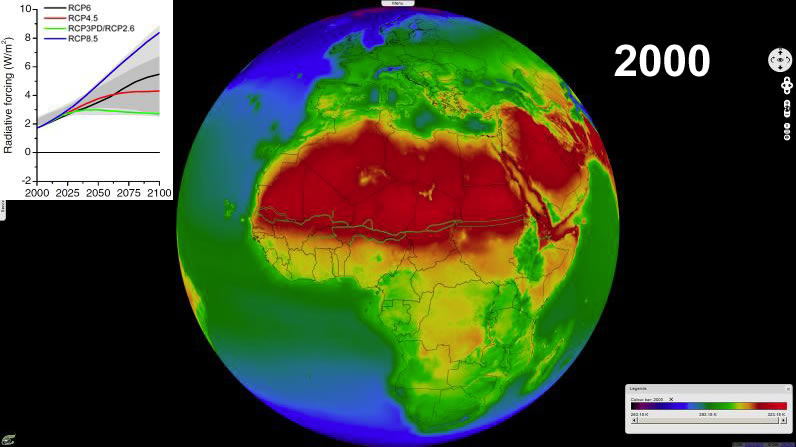
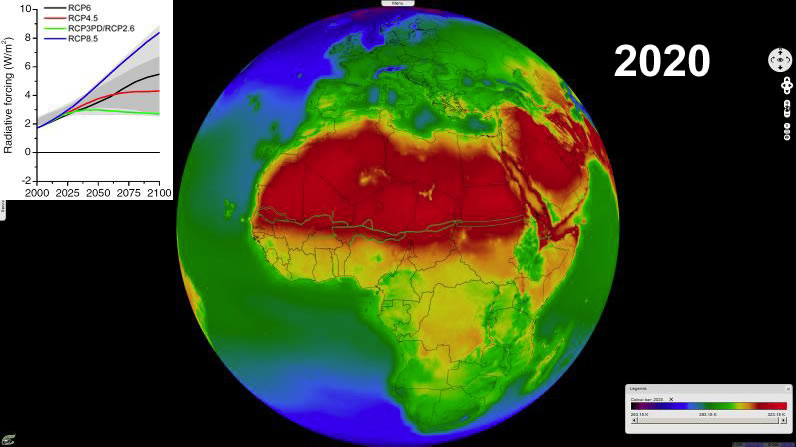
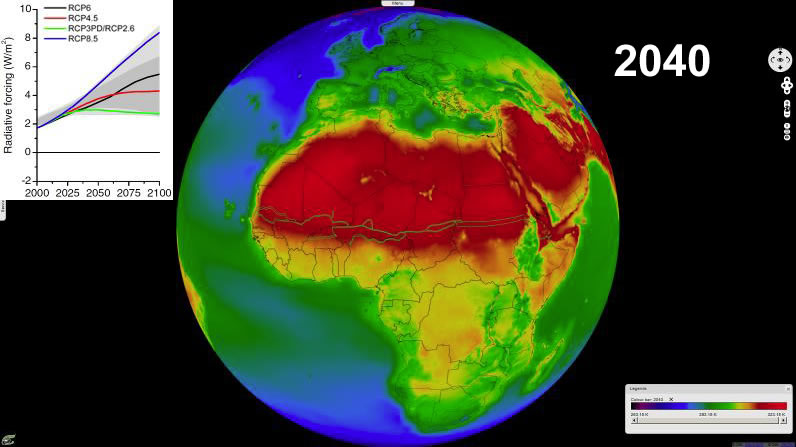
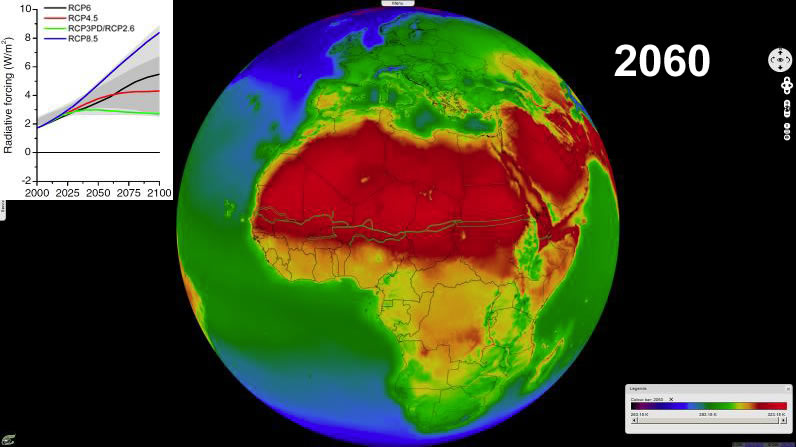
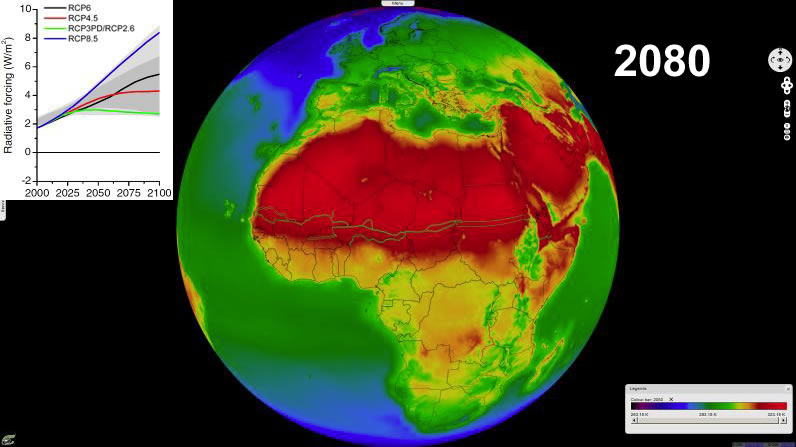
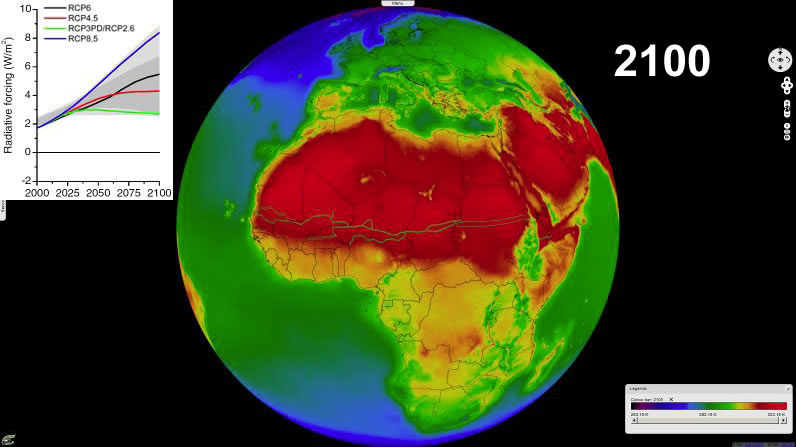
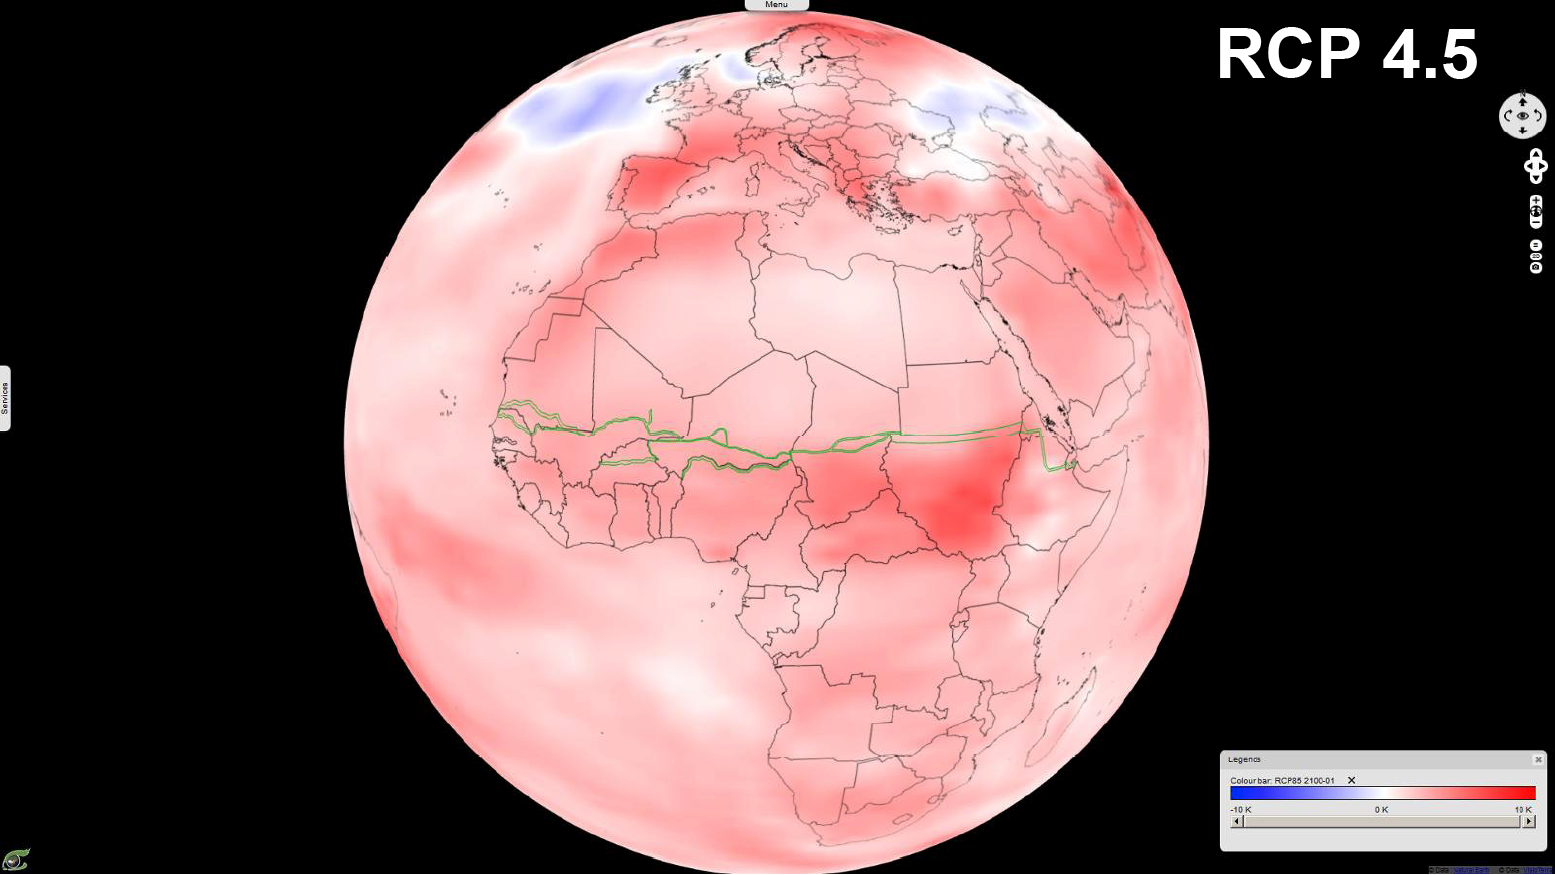
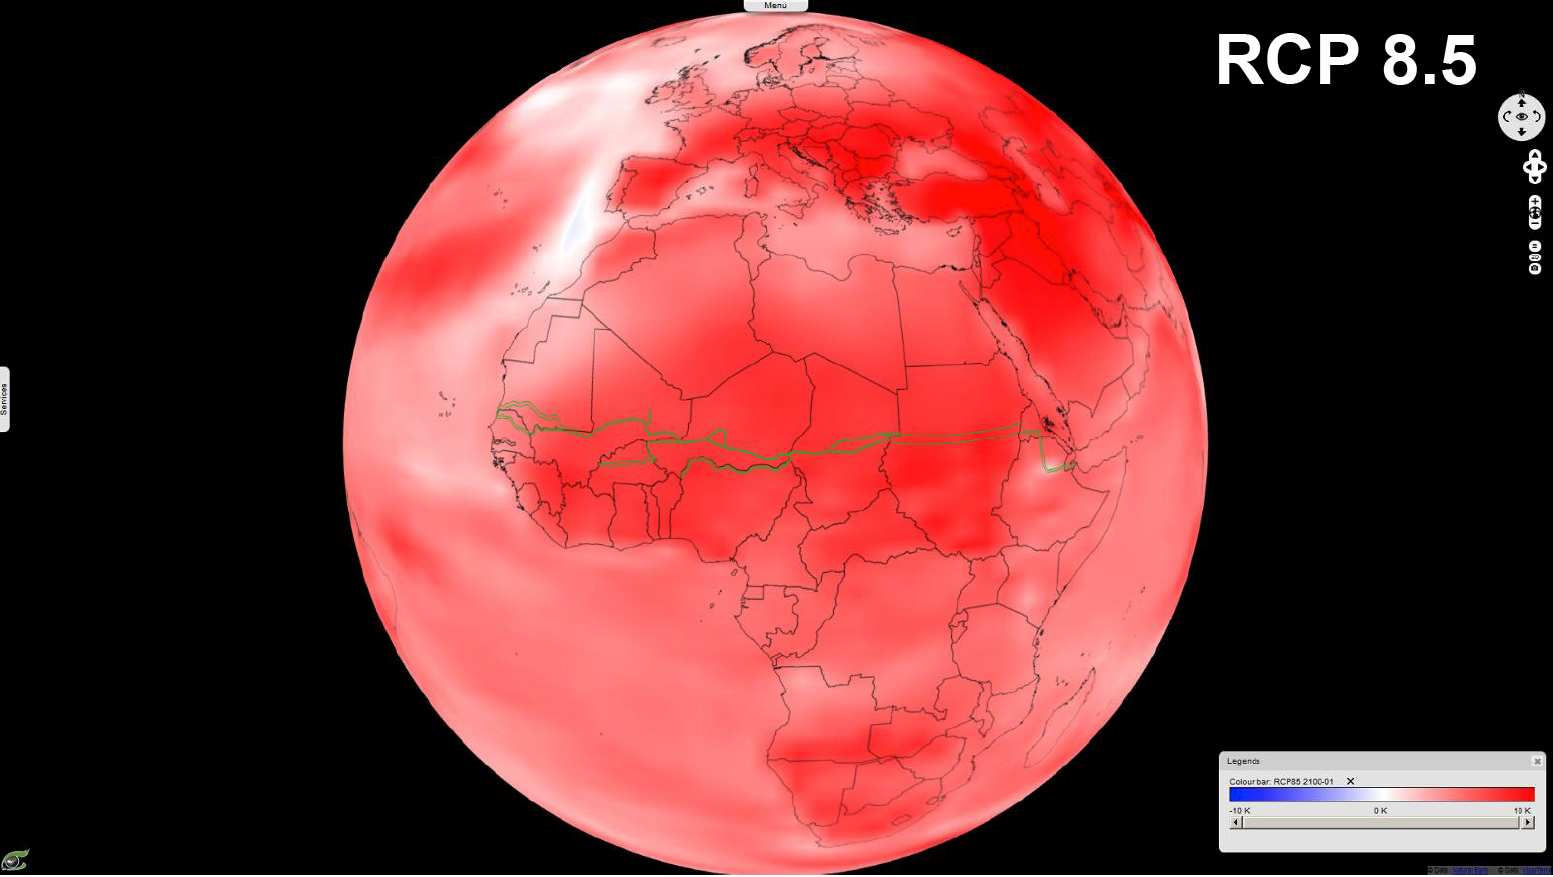
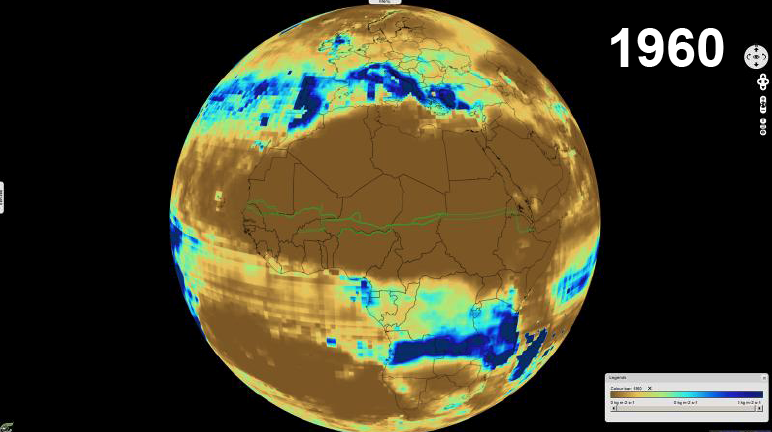
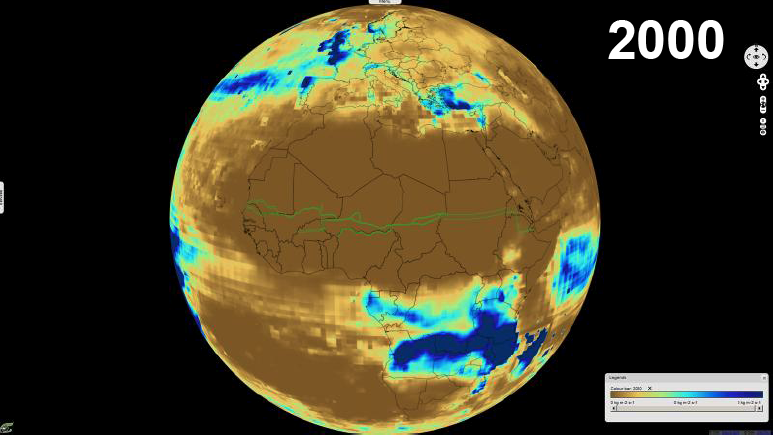
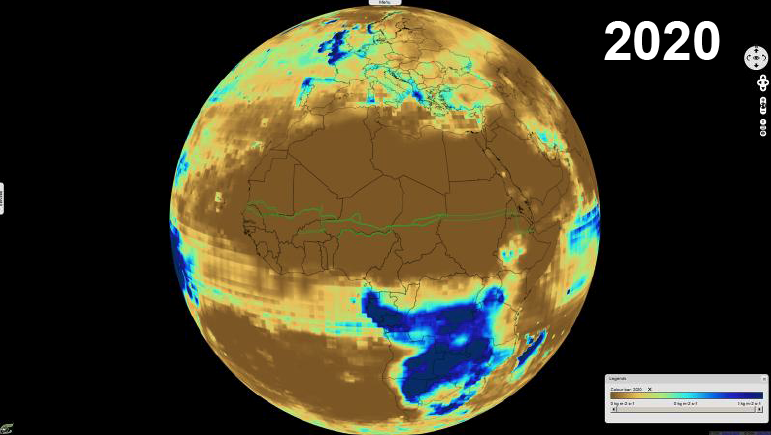
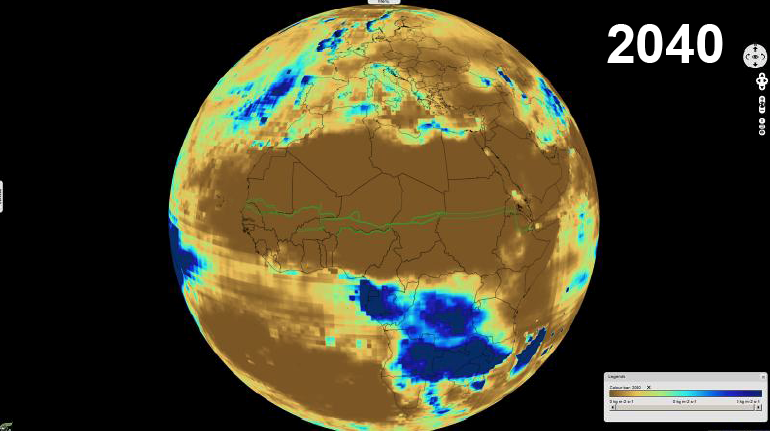
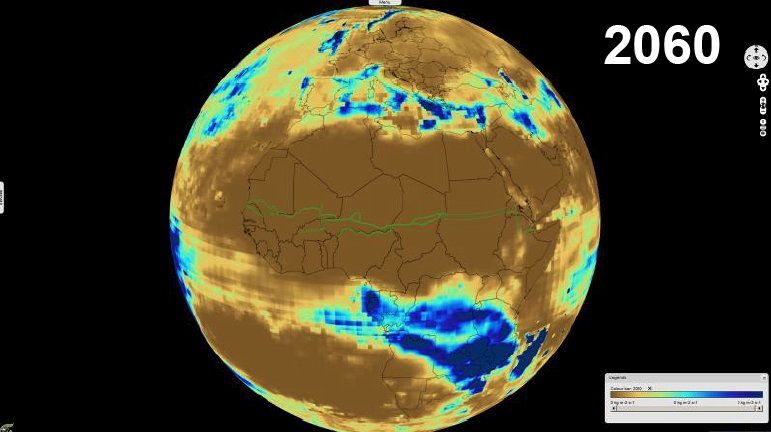
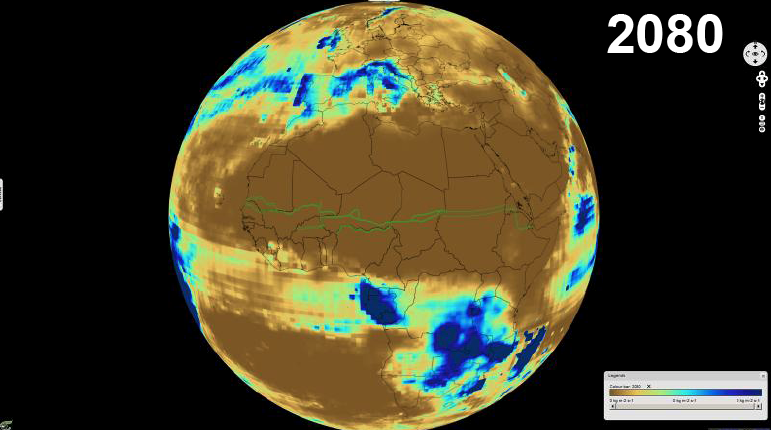
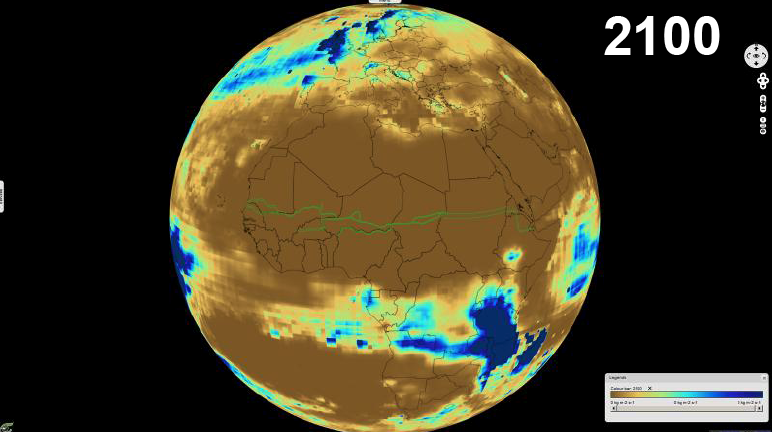
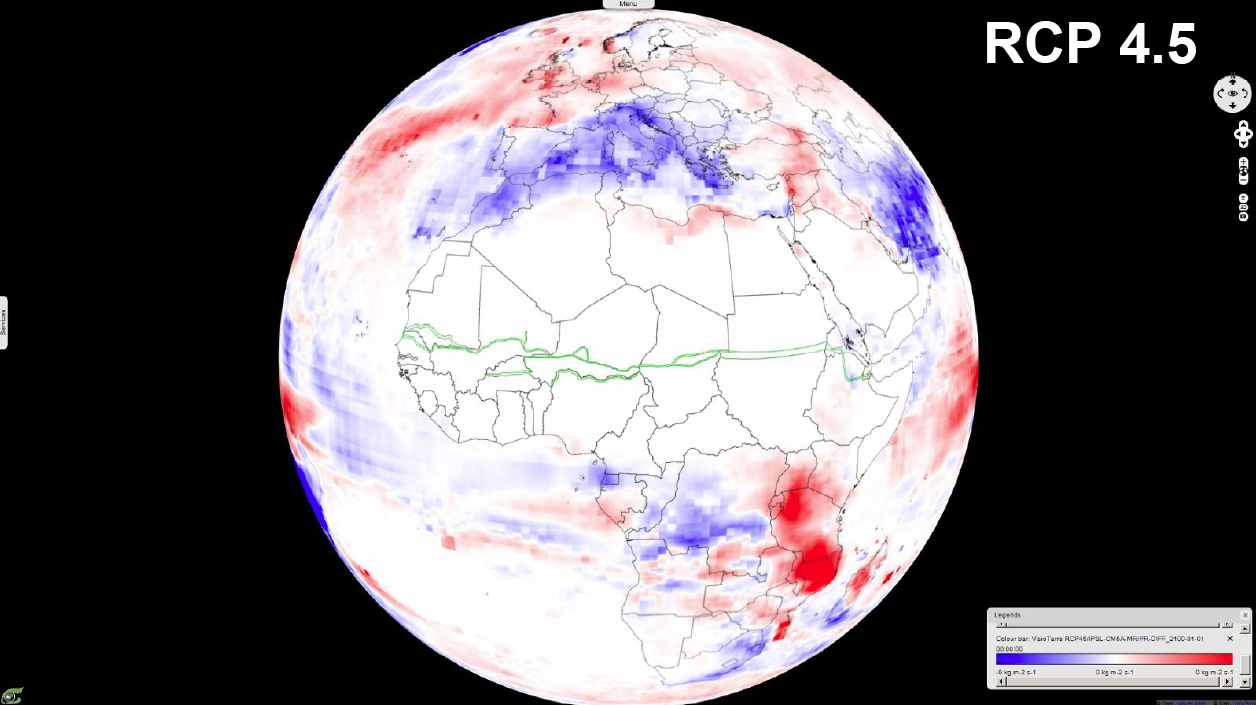
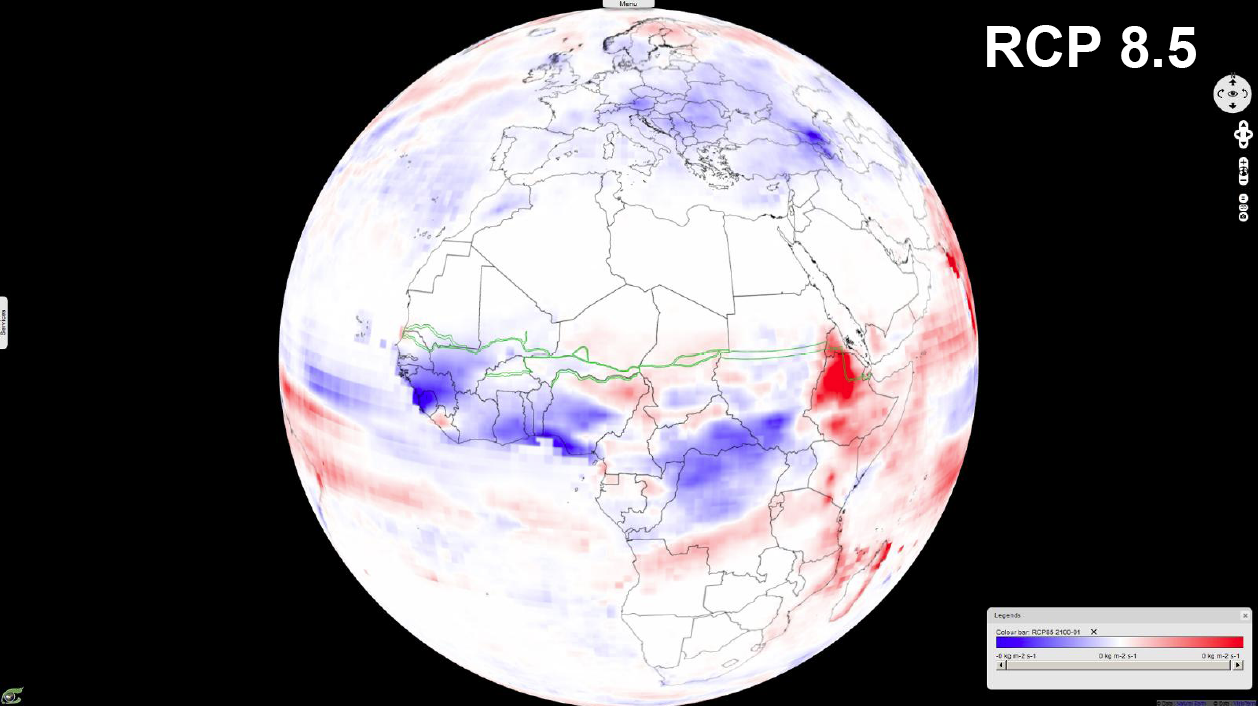
Images below show the projection up to 2100 of temperatures and precipitations computed from the climate change model of IPSL.

IPSL (Institut Pierre Simon Laplace) CM5A-MR (Earth System Model) according to 4.5 and 8.5 W/m2 RCP (Representative Concentration Pathways) of the ICMP5 (Coupled Model Intercomparison Project Phase 5).
2D_layer_stack
3D_layer_stack


RCP 8.5 maximum temperature - July - 1960…2100
2D_animation
3D_animation

RCP 8.5 maximum temperature - 10 years mean January 1960 to 2100 - range [-10 ; +10] K:
2D_view
3D_view
Maximum temperature - July 2100 (difference v.s. July 1950)
Comparison RCP 4.5 v.s. RCP 8.5 -
2D_animation
3D_animation
RCP 4.5 maximum temperature - 10 years mean July 2100 v.s. July 1950 - range [-10 ; +10] K:
2D_view
3D_view
RCP 8.5 maximum temperature - 10 years mean July 2100 v.s. July 1950 - range [-10 ; +10] K:
2D_view
3D_view
Precipitations - RCP 8.5 - January - 1960…2100
2D_animation
3D_animation
RCP 8.5 precipitation - 10 years mean January 1960 to 2100 - range [-1.e-4 ; +1.e-4] kg.m-2.s-1.
Precipitations - Differences v.s. 1950 - RCP 4.5 / 8.5
2D_animation
3D_animation
RCP 4.5 precipitation - 10 years mean January 2100 v.s. January 1950 - range [-1.e-4 ; +1.e-4] kg.m-2.s-1:
2D_view
3D_view
RCP 8.5 precipitation - 10 years mean January 2100 v.s. January 1950 - range [-1.e-4 ; +1.e-4] kg.m-2.s-1:
2D_view
3D_view


All these « hyperlooks » are interactively processed with VtWeb
 
Copyright © 2017 VisioTerra, All rights reserved.


Want to change how you receive these emails?
You can update your preferences or unsubscribe from this list