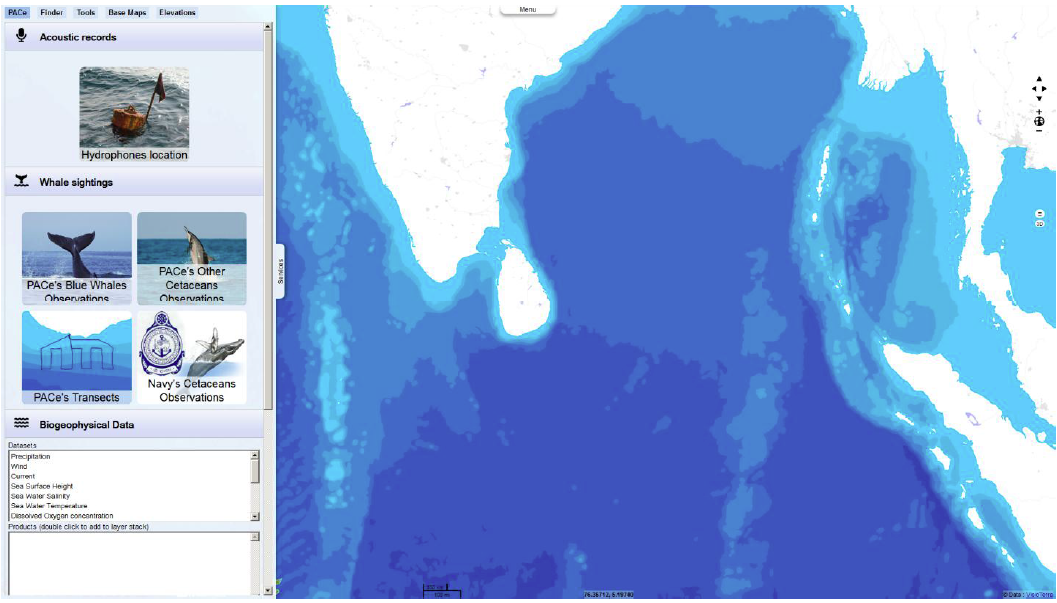
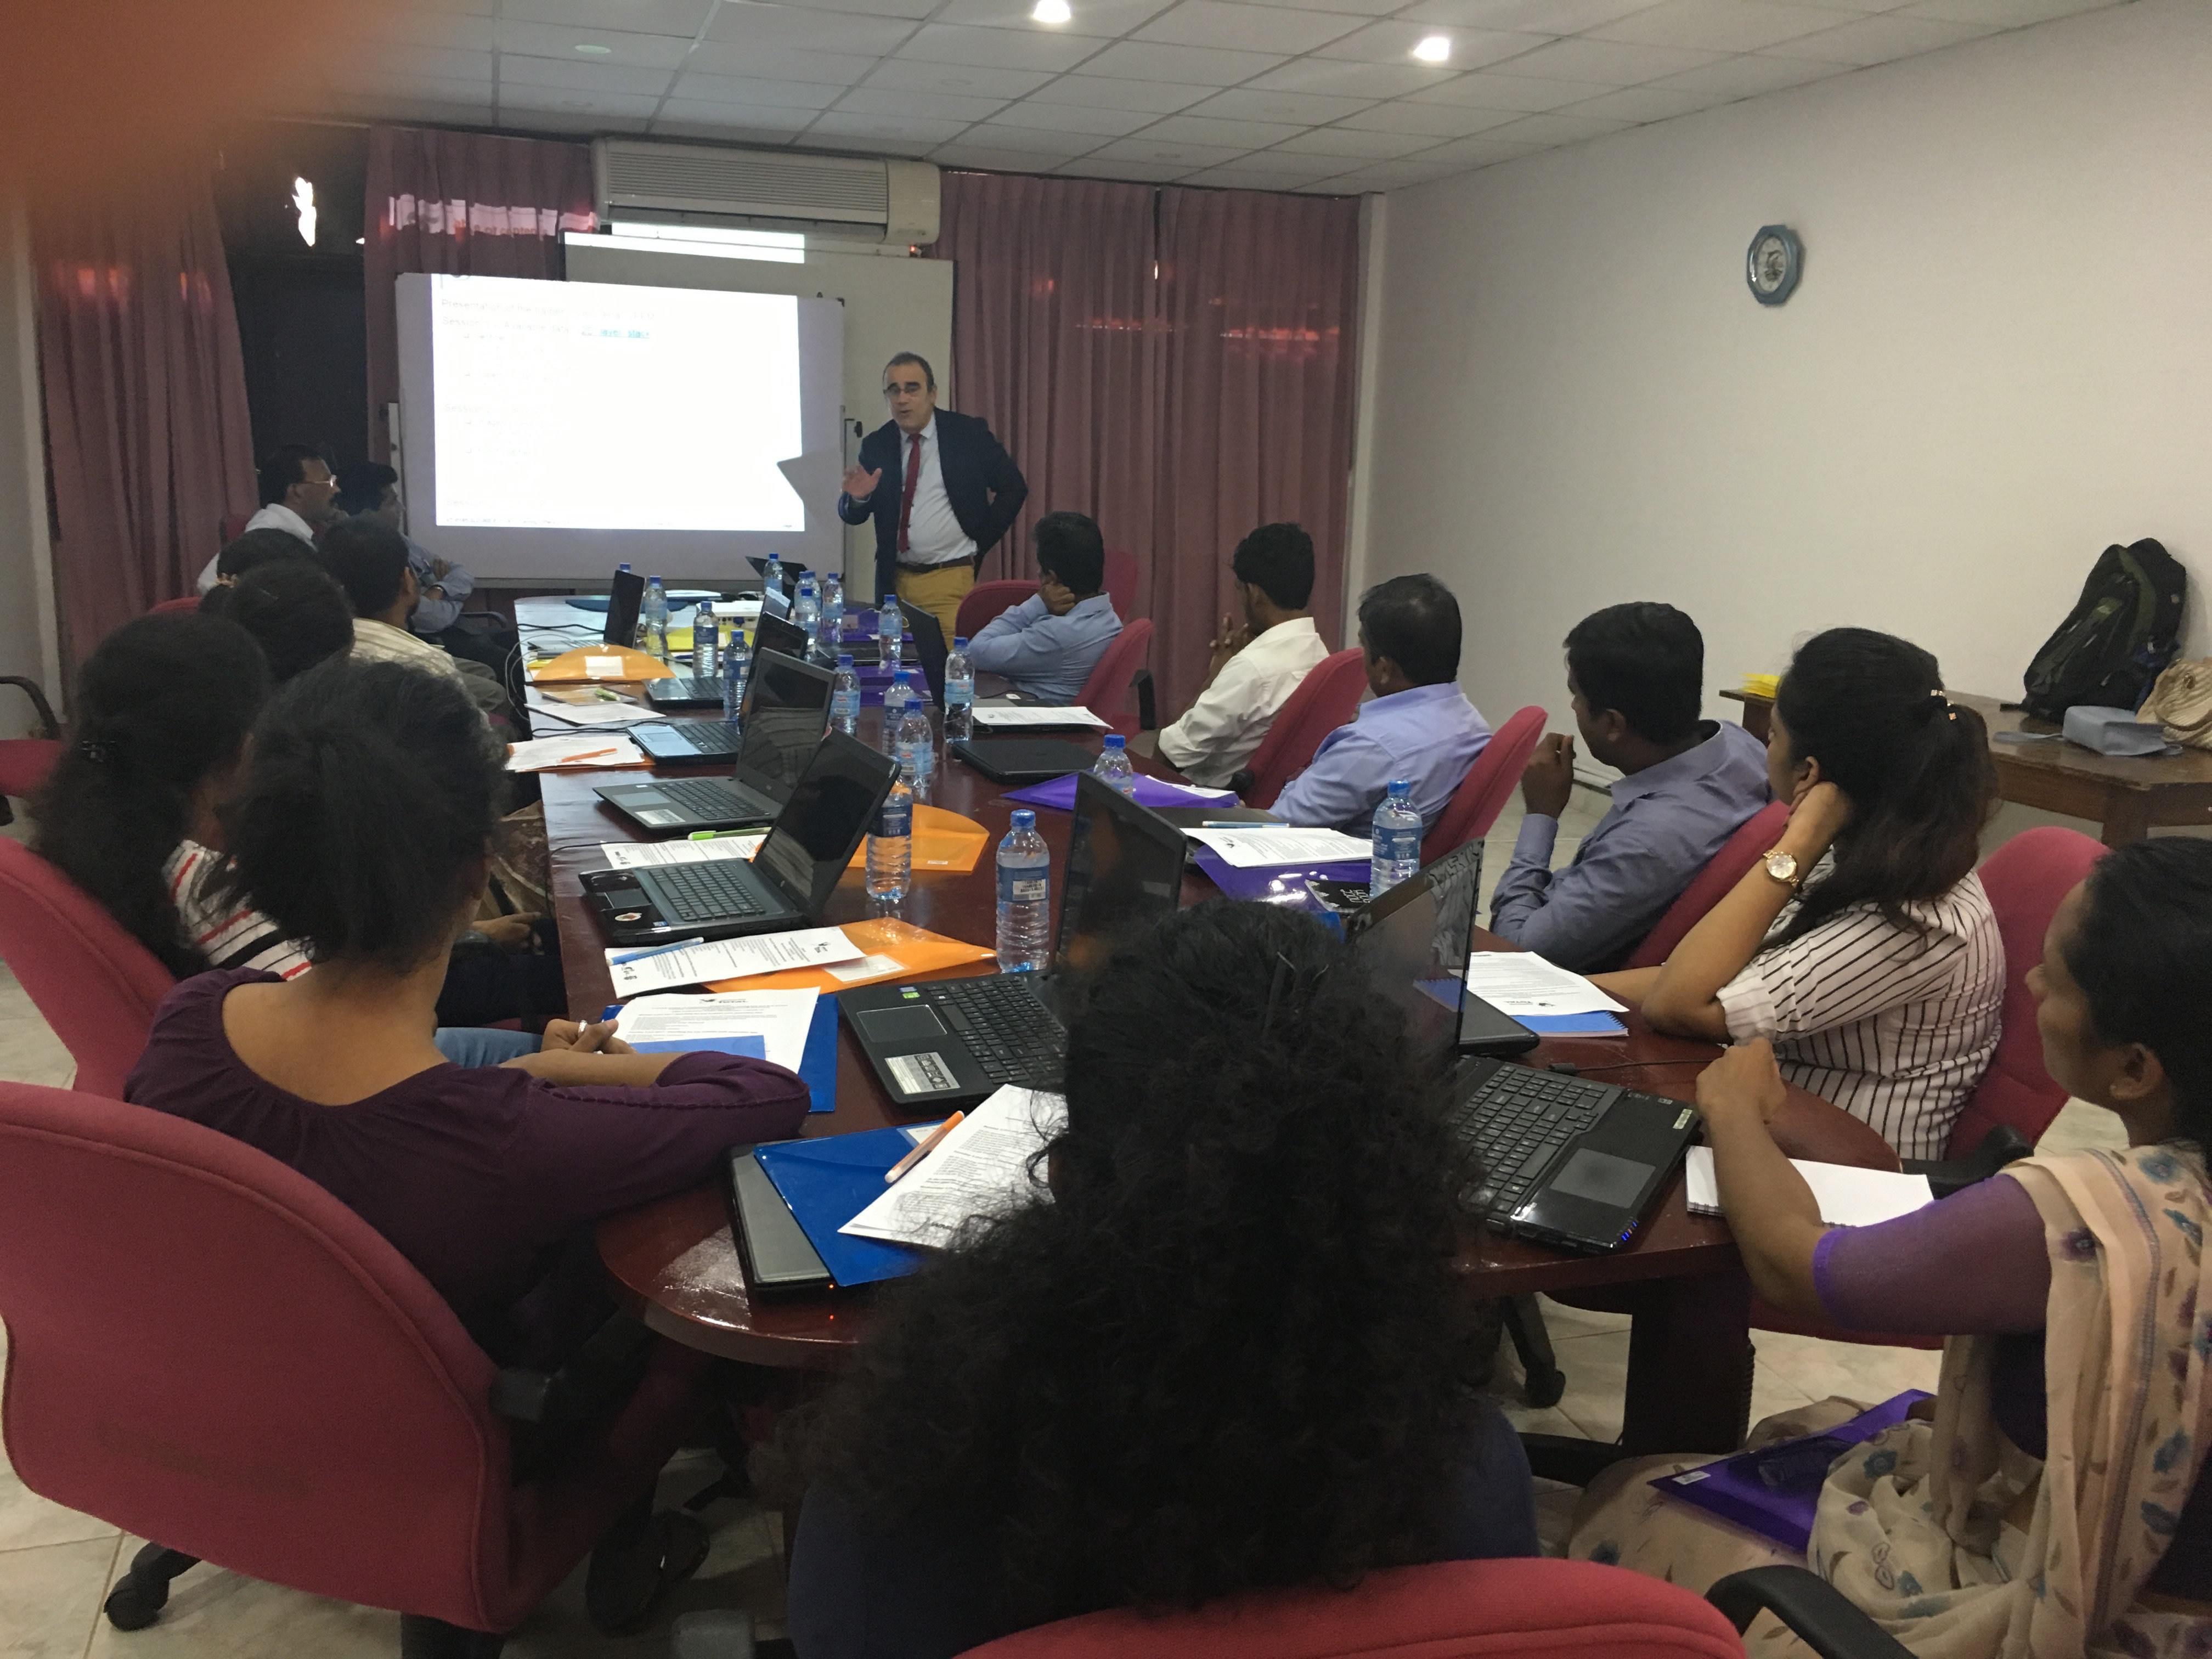
Training session on integrating GIS and remote sensing data into Web portals
Presentation of PACe
Project coordinator : Annukka PEKARINEN
Summary
The main issues PACe project is responding to is the lack of knowledge concerning the cetacean populations of the world and specifically the lack of spatial data for ecosystem based management initiatives. The movements and status of regional and seasonal populations and the factors that direct the population distribution in Sri Lankan waters are largely unknown. A few scientific visual surveys have been undertaken in Sri Lanka during last ten years but comprehensive mapping of whale populations in this area is missing.
Objectives
To produce basic data on cetacean populations to improve knowledge on cetacean biodiversity, abundance and important habitats, to be used for management purposes.
In addition to regular scientific reports and articles, spatial data on cetacean populations and their important habitats is produced and distributed among general public and professionals in ocean management.
Management procedures suitable for the study area will also be proposed.
Project timeline
03.12.2013 – Kick-off meeting in University of Ruhuna.
March 2014 to May 2016 – Field works (passive acoustic monitoring, visual survey and oceanography works).
07.11.2014 – 1st steering committee in VisioTerra, Champs-sur-Marne, France.
26.11.2015 – 2nd steering committee in WMU, Malmö, Sweden
13.01.2017 – Final steering committee in WMU, Malmö, Sweden
02-06.10.2017 – Training VtPace – Extension until end 2017.
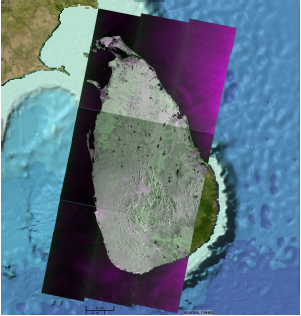
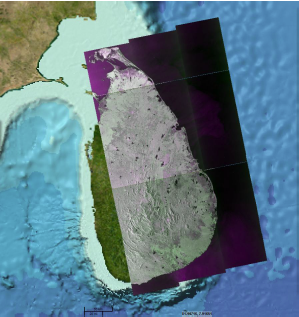
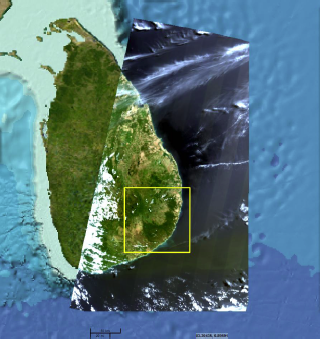
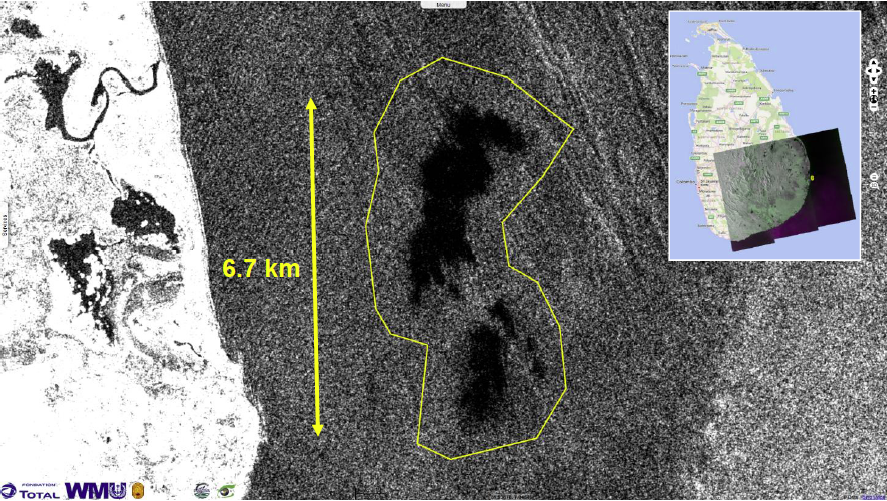
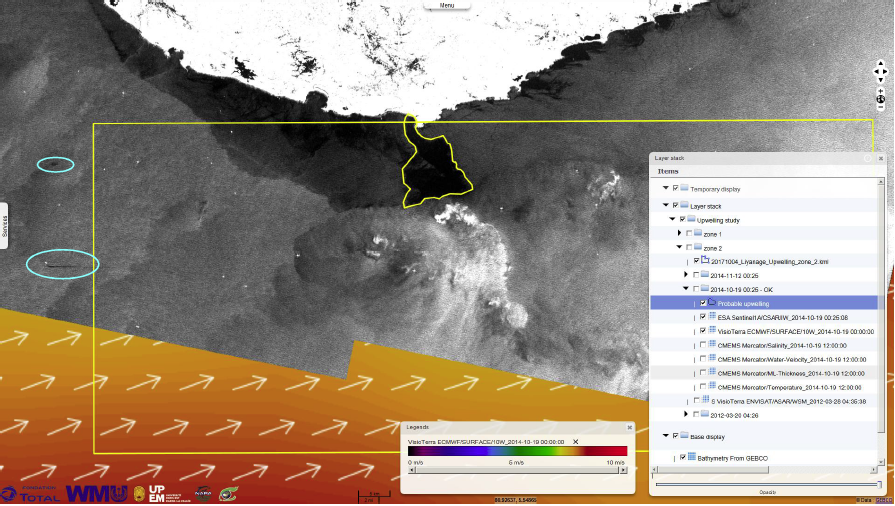
Theme 3 – Upwelling seen from Radar data
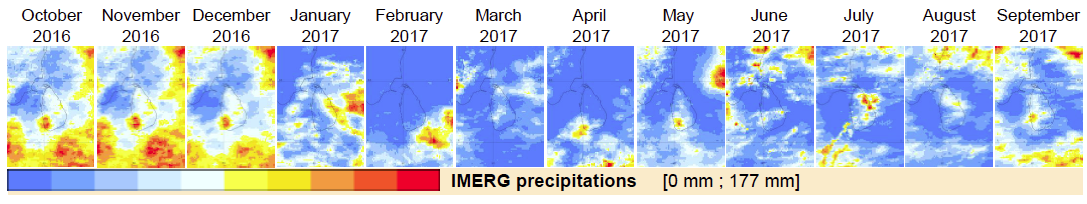
(+checking contemporaneous meteorological data)
Sentinel-1 19.10.2014 00:25:08 GMT in zone 2 - 2D_view
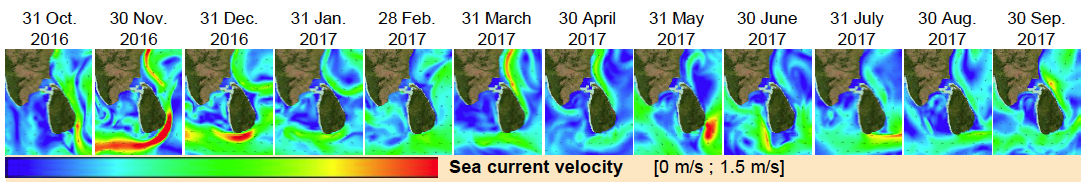
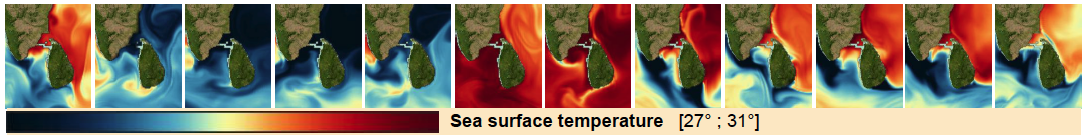
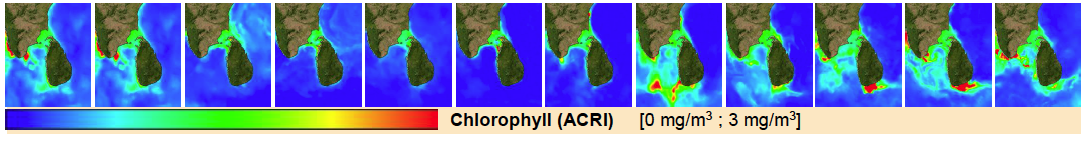
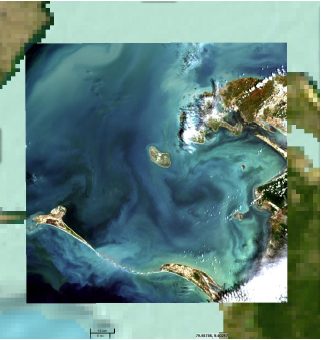
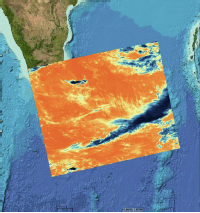
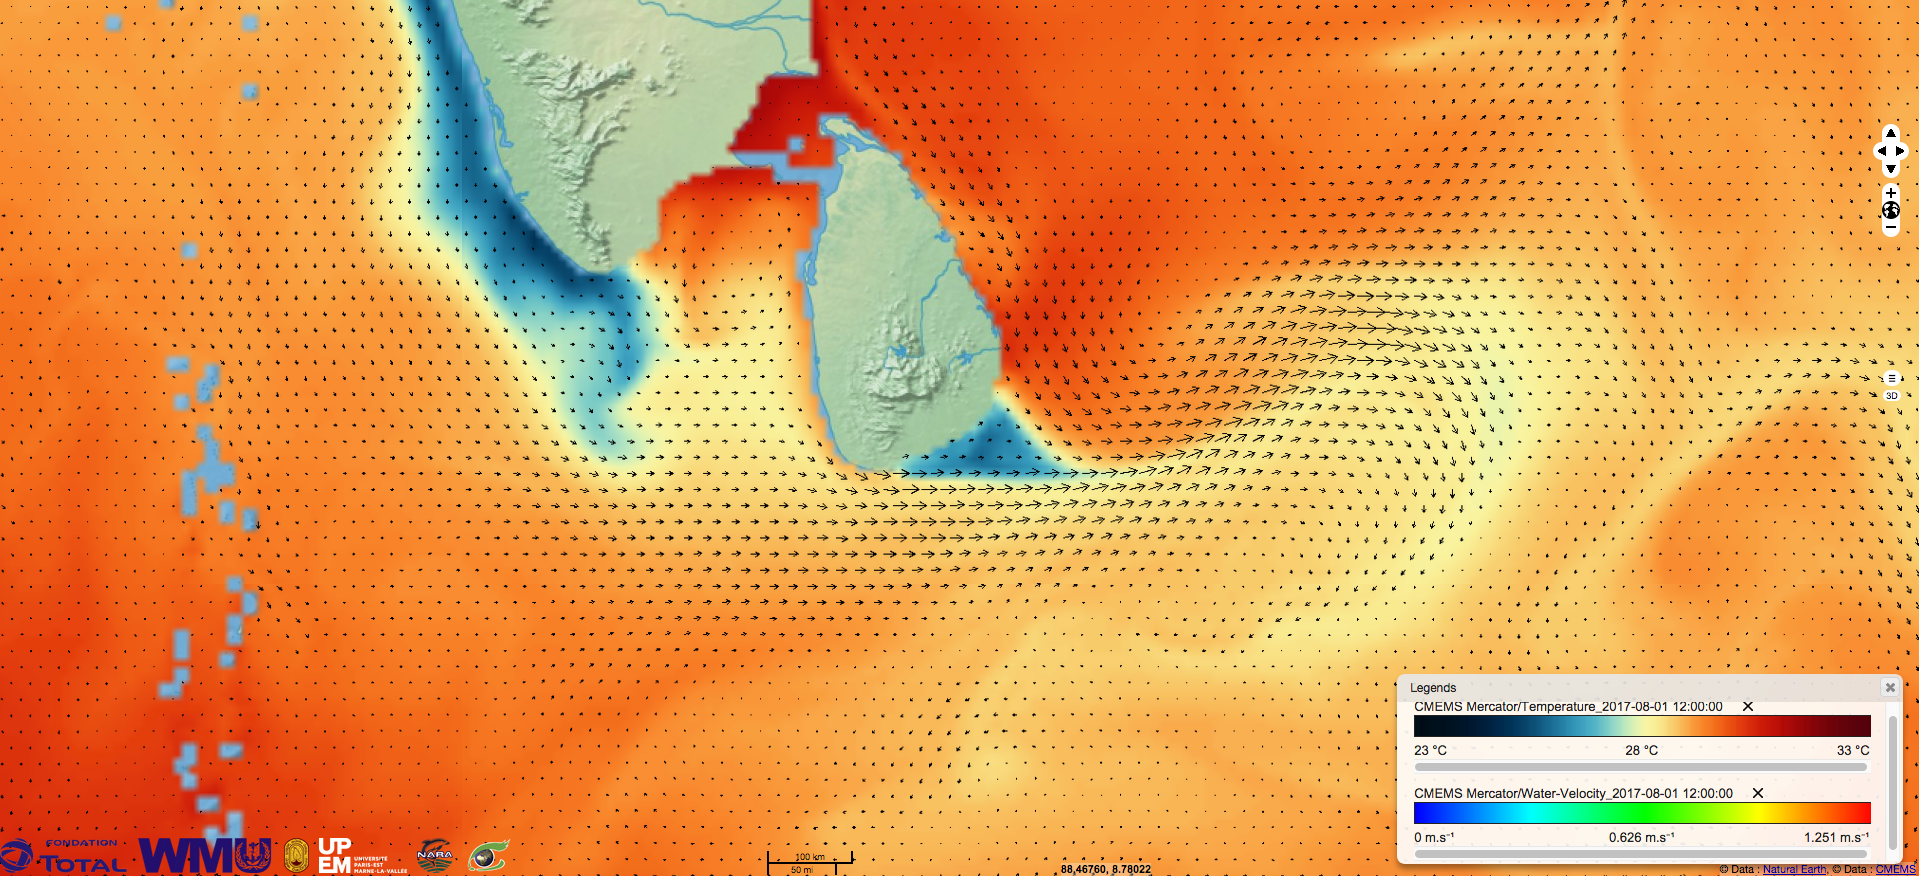
Theme 3 – Upwelling from CMEMS
SST and currents
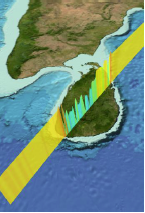
“Flows along the eastern and western coasts of Sri Lanka are southward, and converge along the southern coast. As the surface water is flowing offshore, there is a divergence of water on the coast, which results in a coastal upwelling. Upwellings bring cold, nutrient rich and oxygen poor water on the surface, this is the reason why we can use temperature data to see upwellings.” (Yéelen OLIVE; VisioTerra)
01.08.2017 - CMEMS / Mercator “Ocean sea water potential temperature” and “Surface water velocity and direction” 2D_stack